Fig. 5
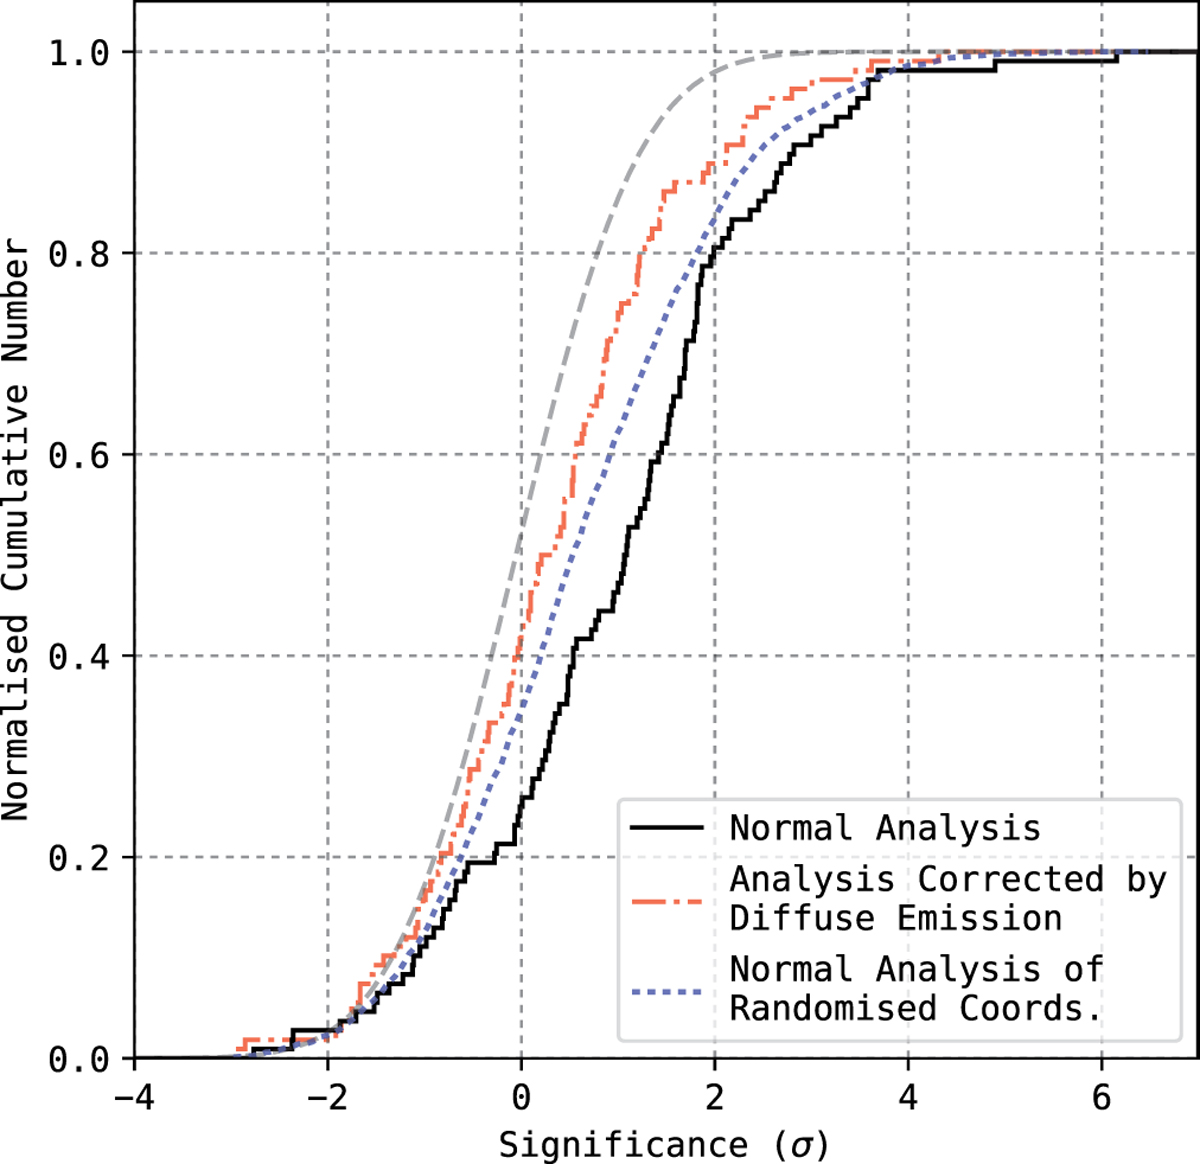
Cumulated significance distribution of the SNR sample (black) and analogous distribution corrected for the Galactic diffuse emission component (dash-dotted red). The cumulated density function from the analysis of randomised test regions is shown in dotted blue. The grey dashed curve represents a cumulated normal Gaussian distribution.
Current usage metrics show cumulative count of Article Views (full-text article views including HTML views, PDF and ePub downloads, according to the available data) and Abstracts Views on Vision4Press platform.
Data correspond to usage on the plateform after 2015. The current usage metrics is available 48-96 hours after online publication and is updated daily on week days.
Initial download of the metrics may take a while.