Fig. 4
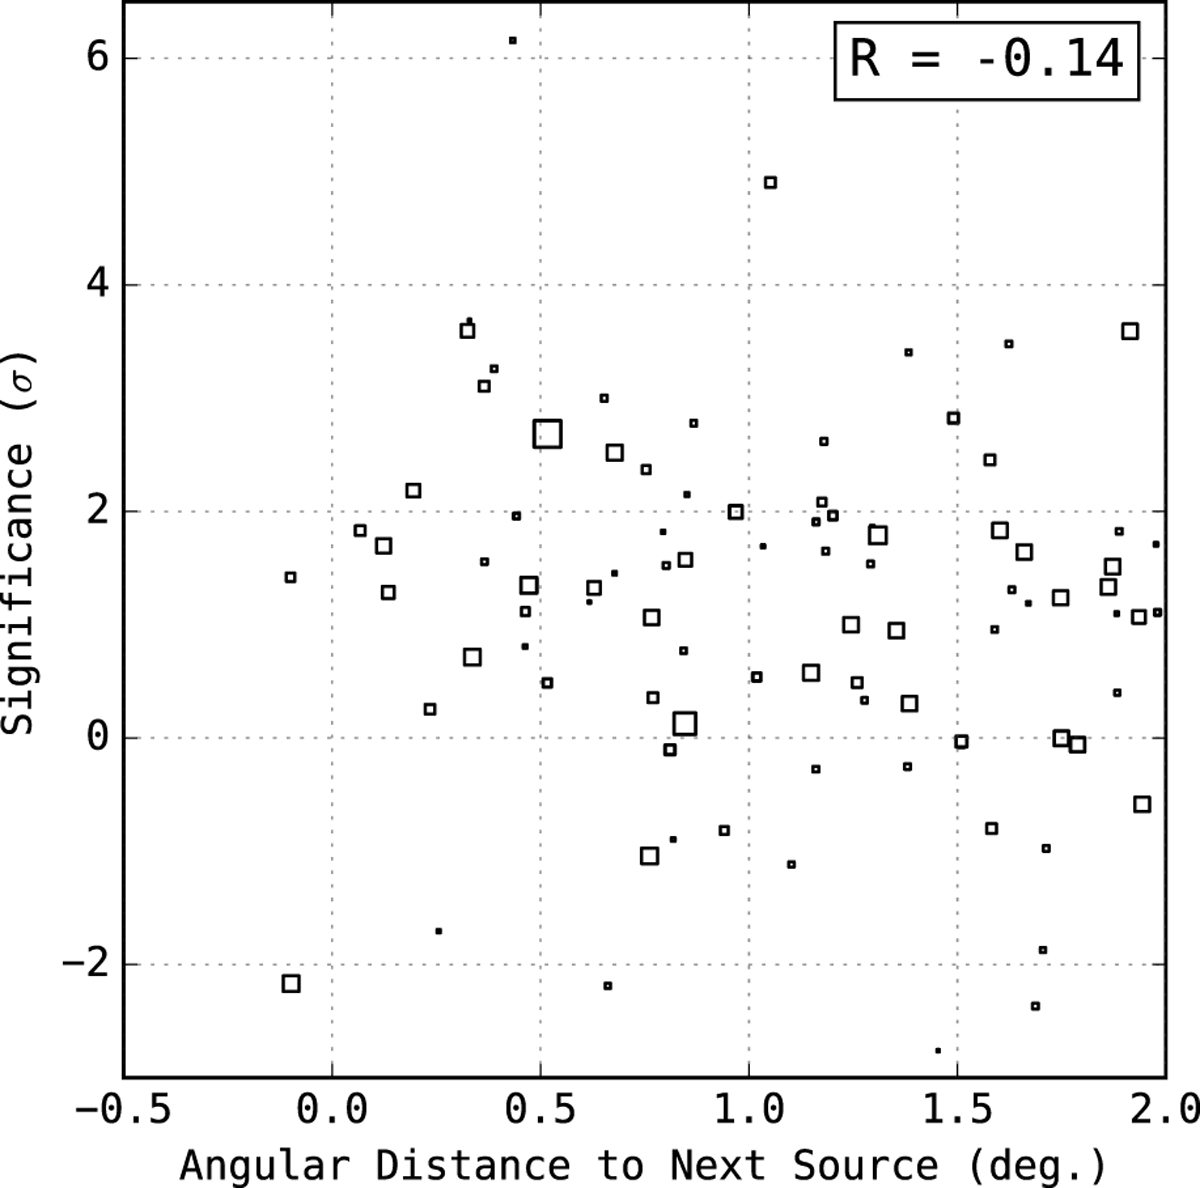
Source significance values of the VHE-dark source sample vs. the angular distance to the nearest detected H.E.S.S. source. The angular distance between the edges of our test regions to that of detected H.E.S.S. sources is shown; the marker size is proportional to the integrated flux above 1 TeV of the latter. The source region positions and sizes are taken from the HGPS, where they are defined as the centroids and 80% containment radii of symmetric and two-dimensional Gaussian fits to the integrated flux map, respectively (see H.E.S.S. Collaboration 2018b for more details). Negative distance values are possible for asymmetric sources where the Gaussian fit does not describe the source morphology well, see e.g. SNR G36.6 −0.7 in Fig. 1.
Current usage metrics show cumulative count of Article Views (full-text article views including HTML views, PDF and ePub downloads, according to the available data) and Abstracts Views on Vision4Press platform.
Data correspond to usage on the plateform after 2015. The current usage metrics is available 48-96 hours after online publication and is updated daily on week days.
Initial download of the metrics may take a while.