Fig. 3
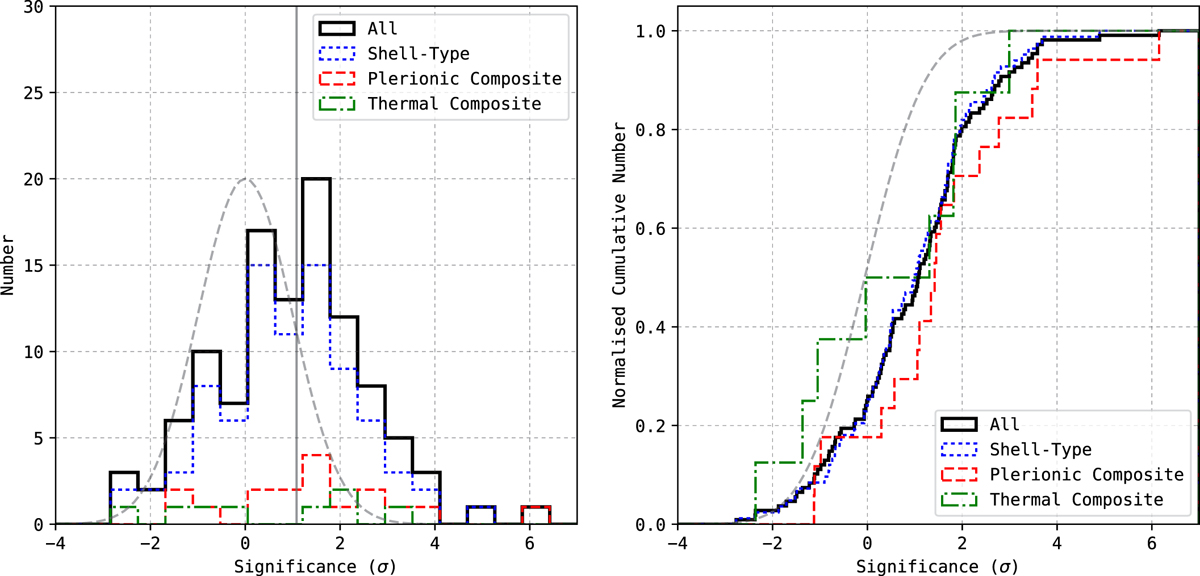
Left: significance distribution of the VHE-dark sample of SNRs (black, blue, red, and green) and the corresponding median value (grey solid). The grey dashed curve indicates a normal Gaussian. Right: cumulative significance distribution of all sources(black), those of shell-type (blue), and composite (red and green) morphology. The grey dashed line represents a cumulative normal Gaussian.
Current usage metrics show cumulative count of Article Views (full-text article views including HTML views, PDF and ePub downloads, according to the available data) and Abstracts Views on Vision4Press platform.
Data correspond to usage on the plateform after 2015. The current usage metrics is available 48-96 hours after online publication and is updated daily on week days.
Initial download of the metrics may take a while.