Fig. B.16
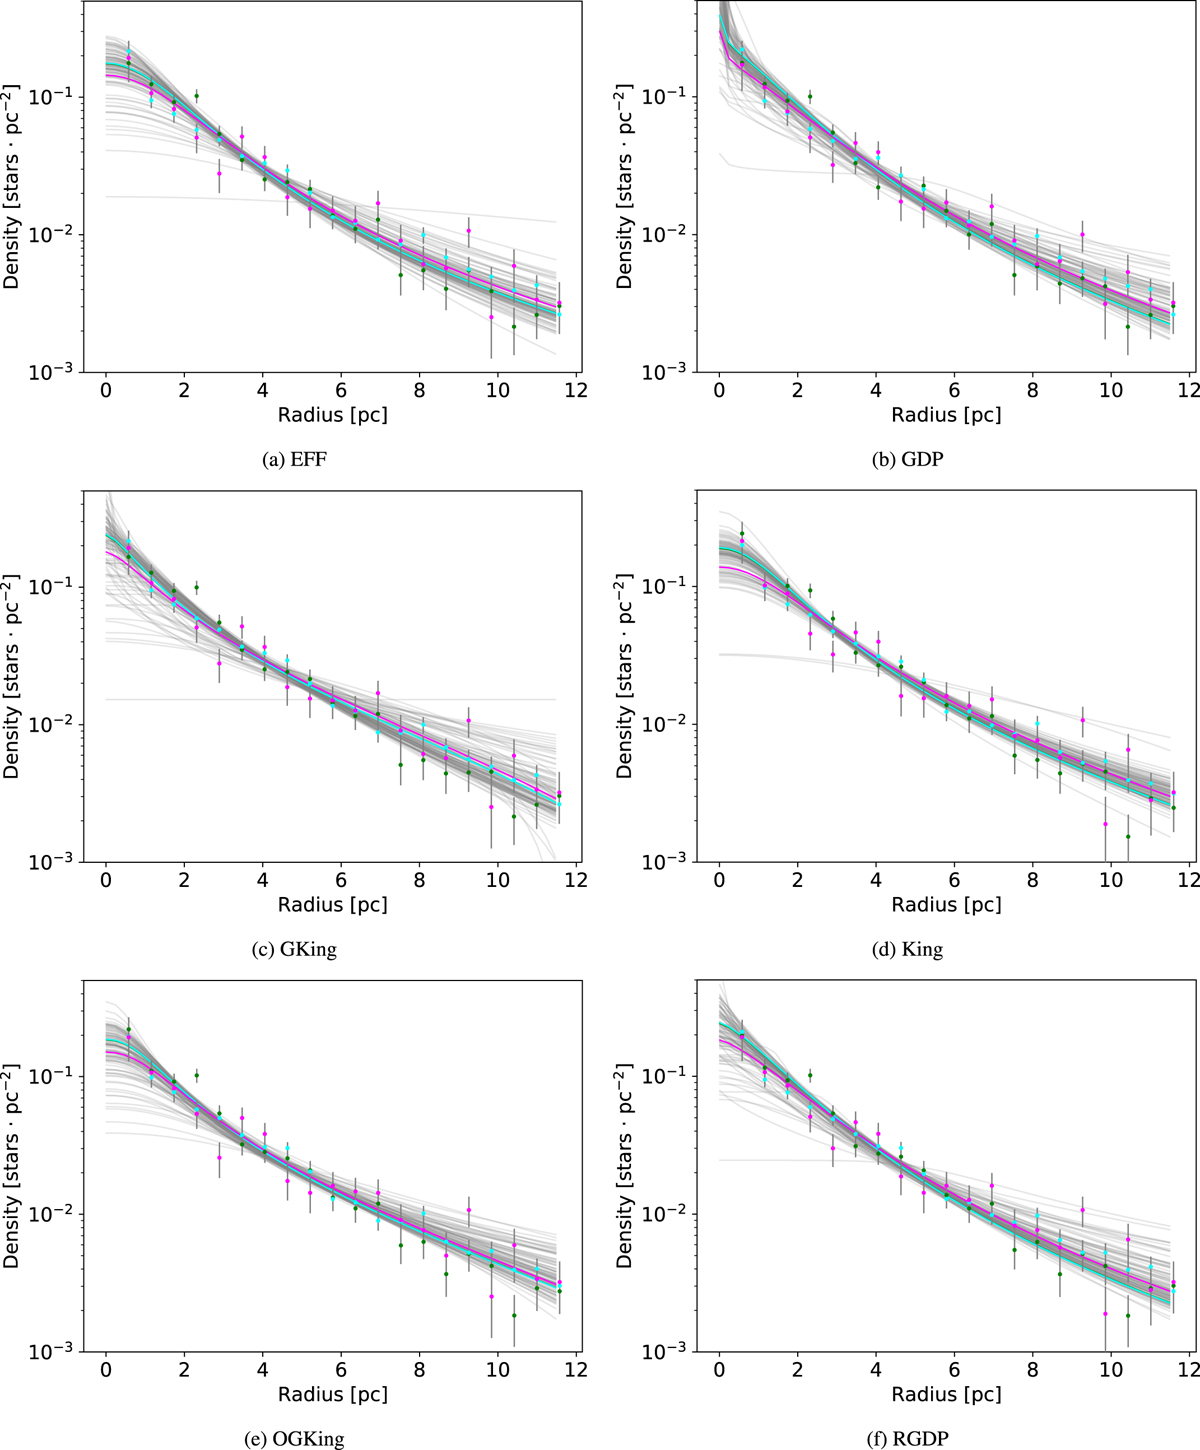
Inferred density of the luminosity segregated models. The data are binned in three bins of the J band: J < 12, 12 ≲ J ≲ 15, and 15 < J (with colours green, cyan and magenta, respectively). The MAP is shown by means of three coloured solid lines, the colours correspond to those of the J band bins. In these MAPs, the core radius is increased accordingly to Eq. (13) using the mean value of the J band in each bin. Also shown are 100 samples from the posterior distribution (grey lines).
Current usage metrics show cumulative count of Article Views (full-text article views including HTML views, PDF and ePub downloads, according to the available data) and Abstracts Views on Vision4Press platform.
Data correspond to usage on the plateform after 2015. The current usage metrics is available 48-96 hours after online publication and is updated daily on week days.
Initial download of the metrics may take a while.