Fig. 1
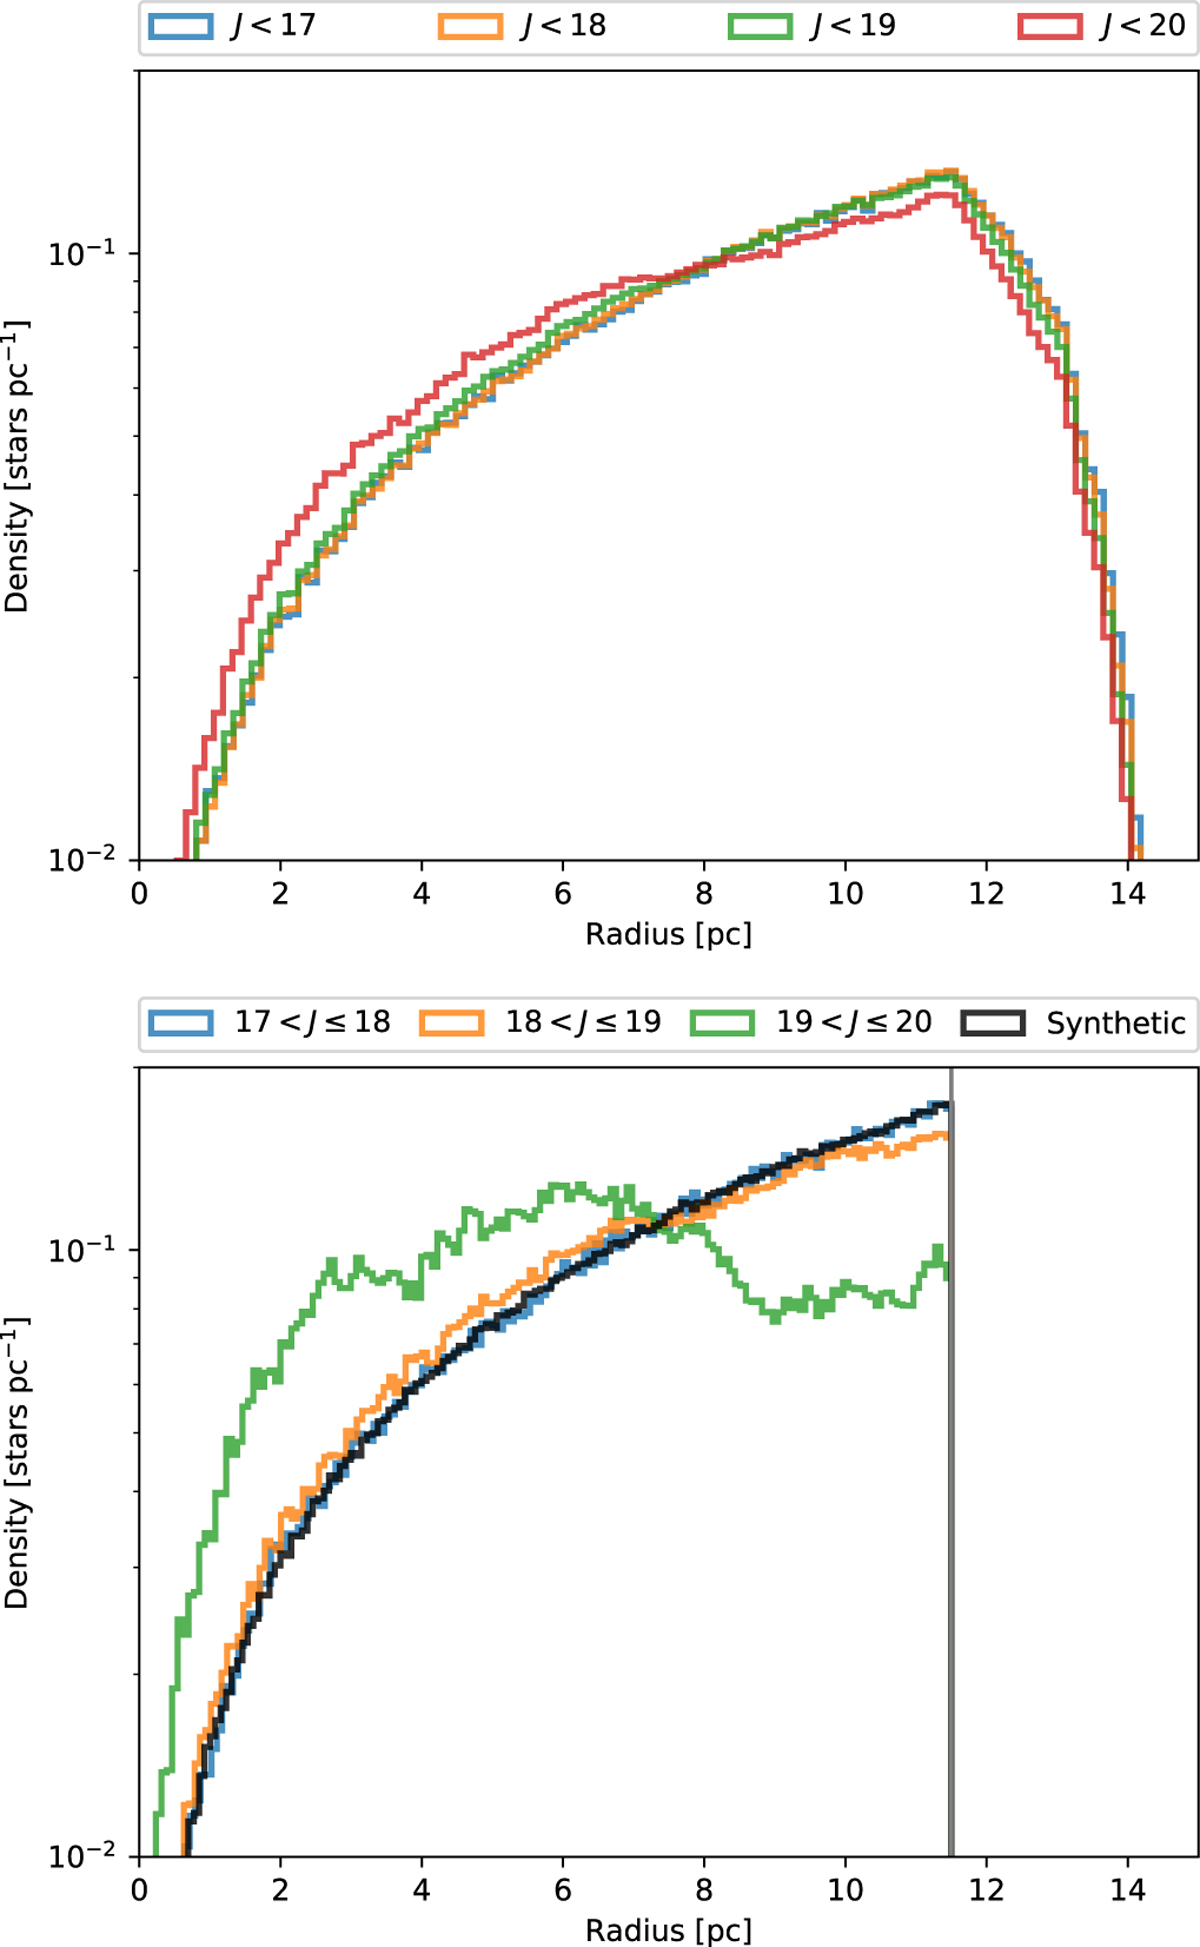
Density of sources in the combined DANCe + Tycho catalogue as a function of the radial distance to the cluster centre and the J magnitude. Top panel: all sources contained within the limiting magnitudes. Bottom panel: sources within the 11.5 pc radius of spatial completeness (vertical grey line), and binned in magnitudes. The black line represents the density of two million sources uniformly distributed in the plane of the sky.
Current usage metrics show cumulative count of Article Views (full-text article views including HTML views, PDF and ePub downloads, according to the available data) and Abstracts Views on Vision4Press platform.
Data correspond to usage on the plateform after 2015. The current usage metrics is available 48-96 hours after online publication and is updated daily on week days.
Initial download of the metrics may take a while.