Fig. 4
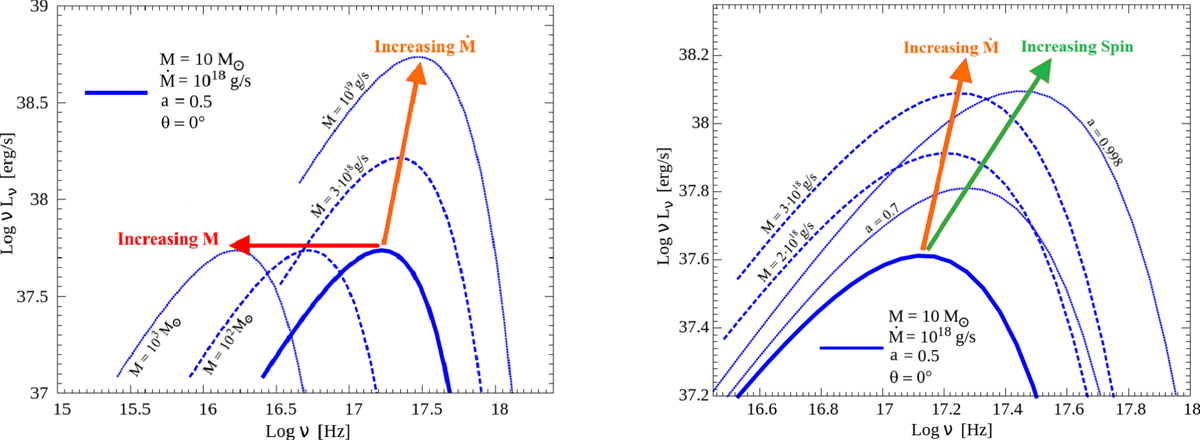
KERRBB accretion disk spectra with different masses, accretion rates and black hole spins. Left panel: the initial 10M⊙ spectrum(blue thick solid line) moves horizontally (i.e., in frequency) when the black hole mass changes (red arrow), and diagonally (i.e., in both frequency and luminosity) when the accretion rate changes (orange arrow). The position of the peak in frequency ν and luminosity νLν for a givenspin value follows the same shifting equations found by Calderone et al. (2013). Right panel: when Ṁ increases, the 10 M⊙ spectrum peak also increases (orange arrow), but less than the increase related to the increase of the spin (green arrow). When a changes the low-frequency part of the spectrum remains constant, but this occurs at frequencies not visible in the figure. The low-frequency flux is produced by the outer regions of the disk, unaffected by the black hole spin. About this effect, see also Fig. 3.
Current usage metrics show cumulative count of Article Views (full-text article views including HTML views, PDF and ePub downloads, according to the available data) and Abstracts Views on Vision4Press platform.
Data correspond to usage on the plateform after 2015. The current usage metrics is available 48-96 hours after online publication and is updated daily on week days.
Initial download of the metrics may take a while.