Fig. C.1
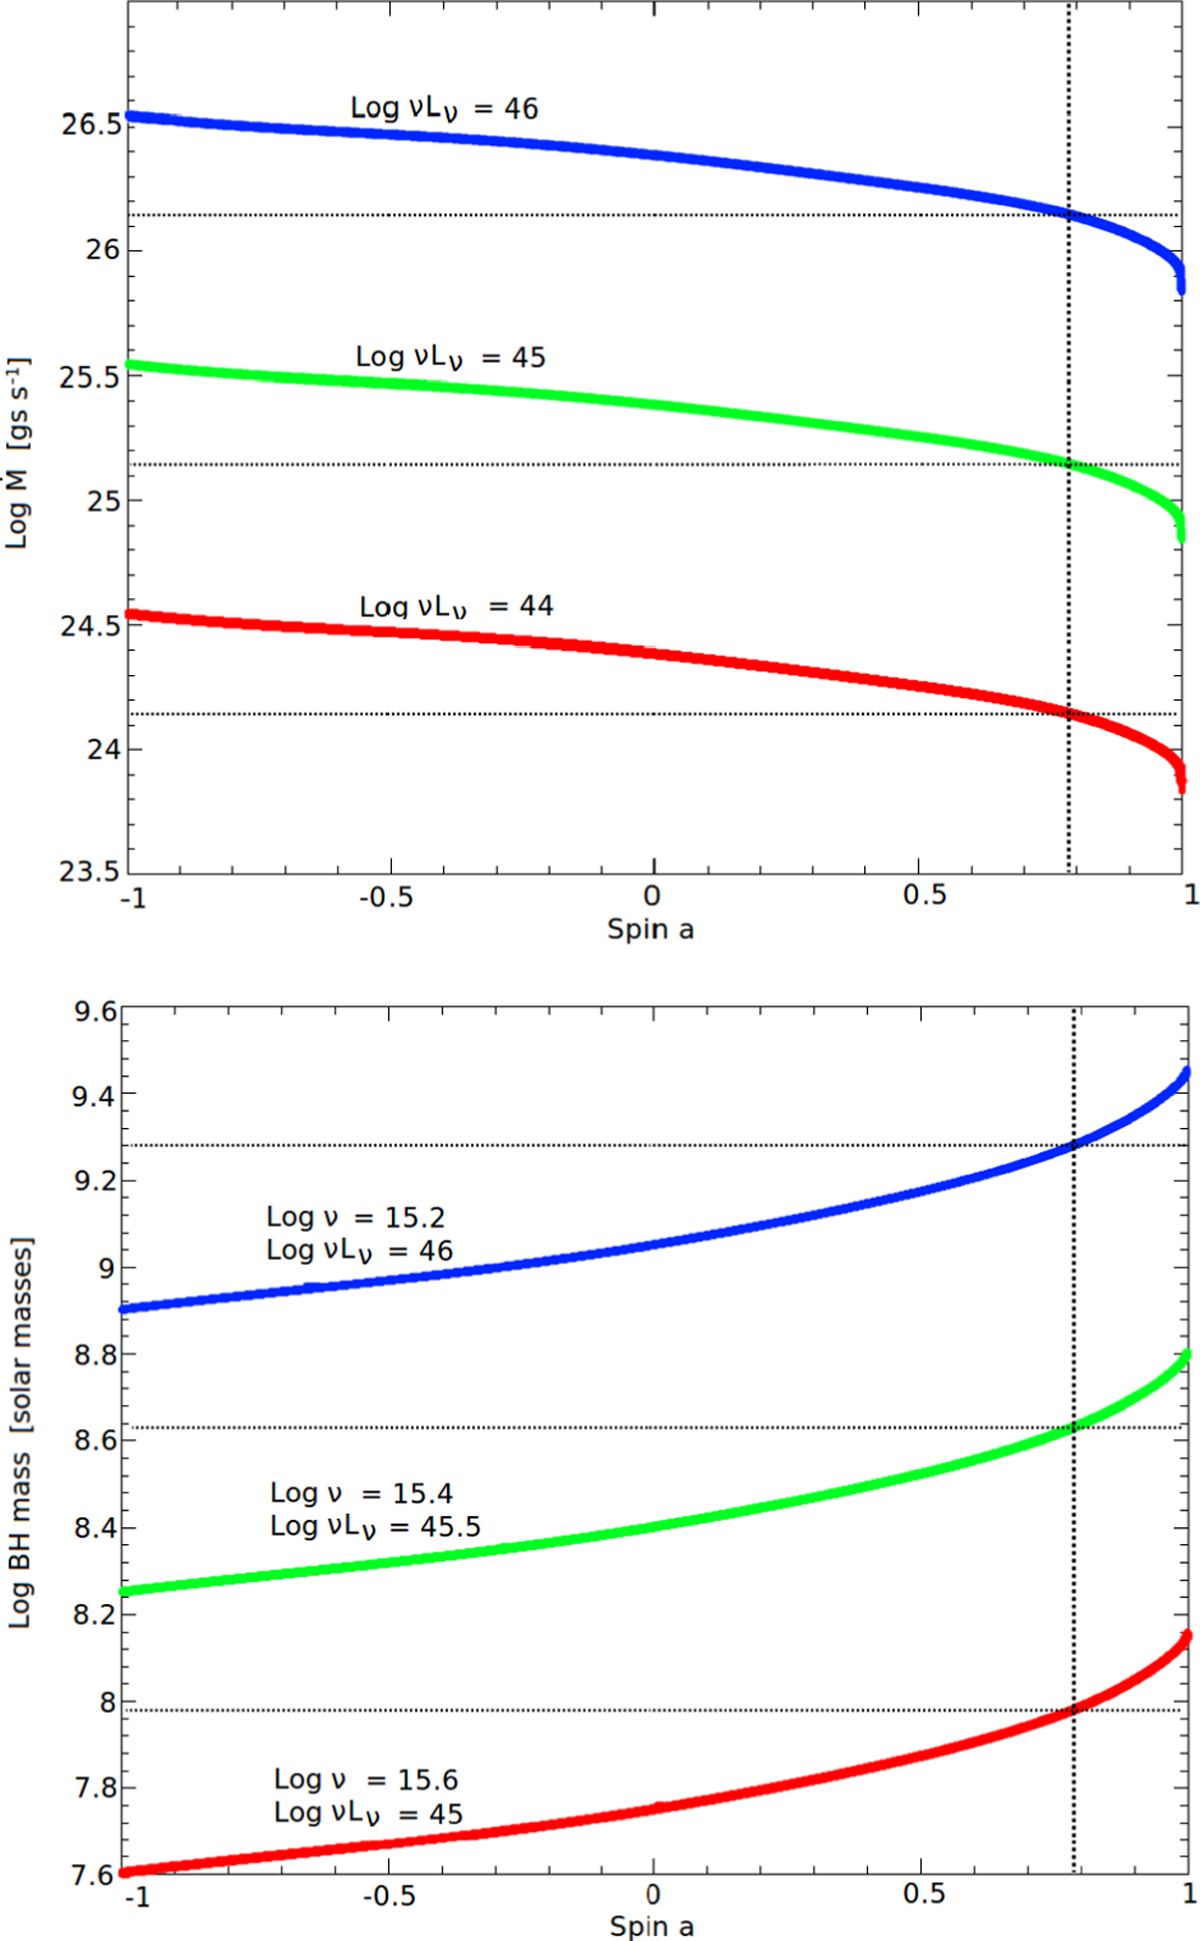
Top panel: relation between the accretion rate Ṁ and the spin a:
different lines are related to different values of peak luminosity ![]() .
Bottom panel:
relation between the black hole mass M
and the spin a:
different lines are related to different couples of peak frequency and luminosity
.
Bottom panel:
relation between the black hole mass M
and the spin a:
different lines are related to different couples of peak frequency and luminosity
![]() .
For every line, the spectrum peak νp
–
.
For every line, the spectrum peak νp
– ![]() and the viewing angle θ = 0° remain fixed. The SS solutions (horizontal dotted lines) with the same peak frequency and luminosity correspond to the KERRBB model with a ~ 0.8 (vertical dotted line). Since the spectrum peak moves to higher frequencies and luminosities by increasing the spin value (see Fig. 5), the mass and the accretion rate must increase and decrease, respectively, in order to keep the spectrum peak in the same position.
and the viewing angle θ = 0° remain fixed. The SS solutions (horizontal dotted lines) with the same peak frequency and luminosity correspond to the KERRBB model with a ~ 0.8 (vertical dotted line). Since the spectrum peak moves to higher frequencies and luminosities by increasing the spin value (see Fig. 5), the mass and the accretion rate must increase and decrease, respectively, in order to keep the spectrum peak in the same position.
Current usage metrics show cumulative count of Article Views (full-text article views including HTML views, PDF and ePub downloads, according to the available data) and Abstracts Views on Vision4Press platform.
Data correspond to usage on the plateform after 2015. The current usage metrics is available 48-96 hours after online publication and is updated daily on week days.
Initial download of the metrics may take a while.