Free Access
Fig. 7
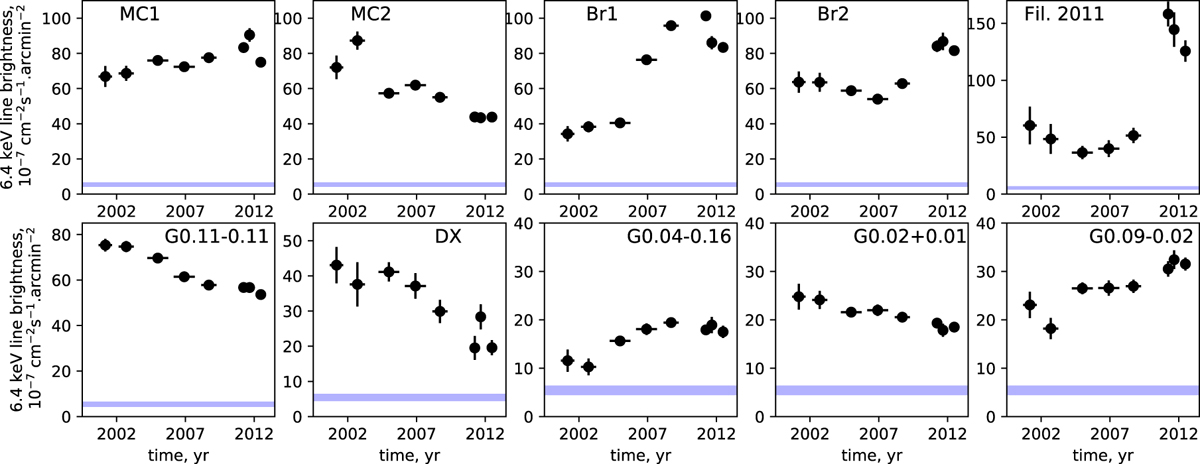
Fe Kα light curve of the illuminated clouds in the Sgr A complex (regions indicated in Fig. 6). The blue band shows the level of background line emission estimated in a large region below Sgr A⋆. All errors shown on the light curves are 1σ errors (68% confidence level).
Current usage metrics show cumulative count of Article Views (full-text article views including HTML views, PDF and ePub downloads, according to the available data) and Abstracts Views on Vision4Press platform.
Data correspond to usage on the plateform after 2015. The current usage metrics is available 48-96 hours after online publication and is updated daily on week days.
Initial download of the metrics may take a while.