Fig. 6
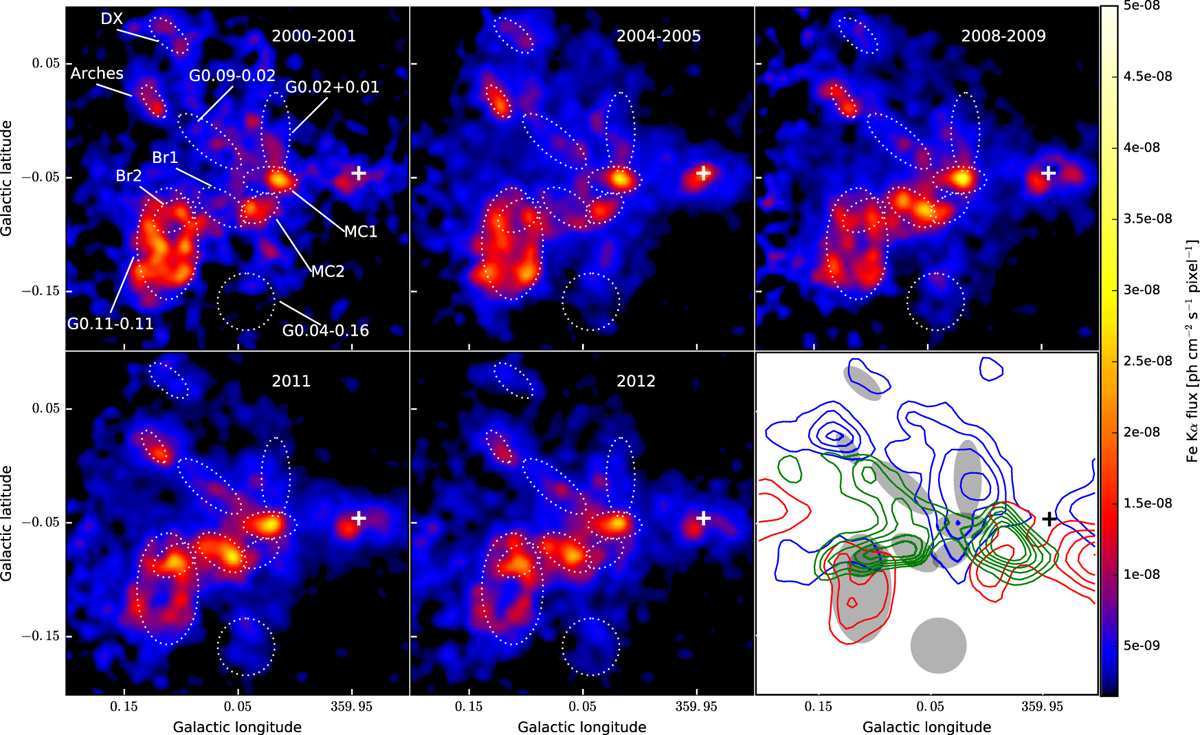
Fe Kα flux images of the Sgr A complex in the period 2000–2012. The dotted lines mark the regions discussed in the text and whose light curves are extracted. The bottom right panel shows the same regions, as grey ellipses, compared to the various structures of the molecular complexes traced by CS shown as solid lines (blue −20–10 km s−1, red 10–40 km s−1 and green 40–70 km s−1). Short timescale (≲2 yr) variations are mostly visible in structures in the last velocity range.
Current usage metrics show cumulative count of Article Views (full-text article views including HTML views, PDF and ePub downloads, according to the available data) and Abstracts Views on Vision4Press platform.
Data correspond to usage on the plateform after 2015. The current usage metrics is available 48-96 hours after online publication and is updated daily on week days.
Initial download of the metrics may take a while.