Fig. 14
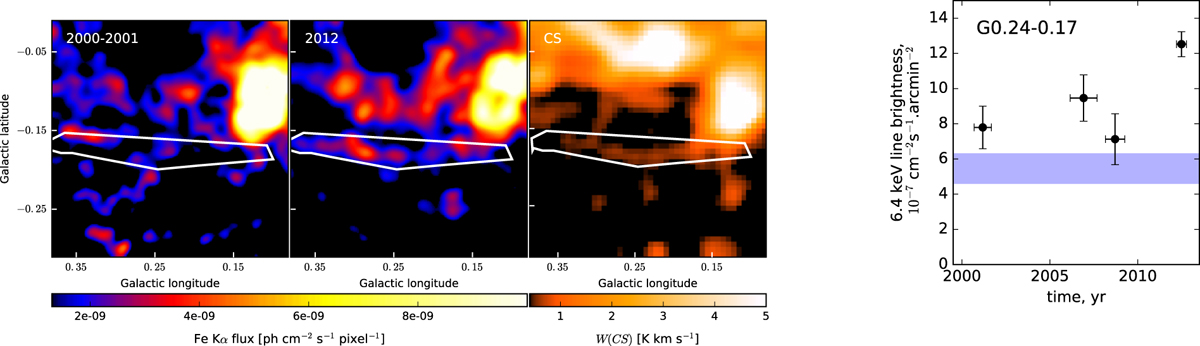
Left images: Fe Kα maps centred at the position of the G0.24–0.17 filament during the 2000–2001 and 2012 XMM-Newton observations. The maps are in units of ph cm−2 s−1 pixel−1, with 2.5″ pixel size, and smoothed using a Gaussian kernel of 8 pixels in radius. Centre: Mopra CS(1–0) map integrated over the 27–35 km s−1 velocity band. Right: Fe Kα light curve of the G0.24–0.17 filament. The blue band indicates the level of background emission measured in a circular region south of Sgr A⋆. All errors shown on the light curves are 1σ errors (68% confidence level).
Current usage metrics show cumulative count of Article Views (full-text article views including HTML views, PDF and ePub downloads, according to the available data) and Abstracts Views on Vision4Press platform.
Data correspond to usage on the plateform after 2015. The current usage metrics is available 48-96 hours after online publication and is updated daily on week days.
Initial download of the metrics may take a while.