Fig. 12
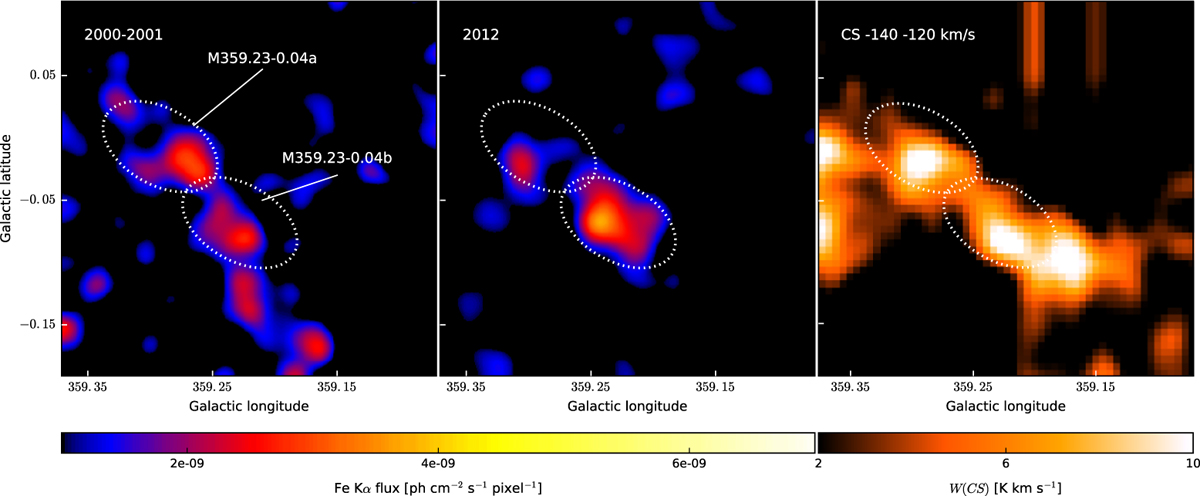
Left: Fe Kα maps centred at the position of the M359.23–0.04 structure during the 2000–2001 and 2012 XMM-Newton observations. The maps are in units of ph cm−2 s−1 pixel−1, with 2.5″ pixel size, and smoothed using a Gaussian kernel of 15 pixels in radius. Right: CS(1–0) map integrated in the −140 to −120 km s −1 velocity band.
Current usage metrics show cumulative count of Article Views (full-text article views including HTML views, PDF and ePub downloads, according to the available data) and Abstracts Views on Vision4Press platform.
Data correspond to usage on the plateform after 2015. The current usage metrics is available 48-96 hours after online publication and is updated daily on week days.
Initial download of the metrics may take a while.