Fig. 10
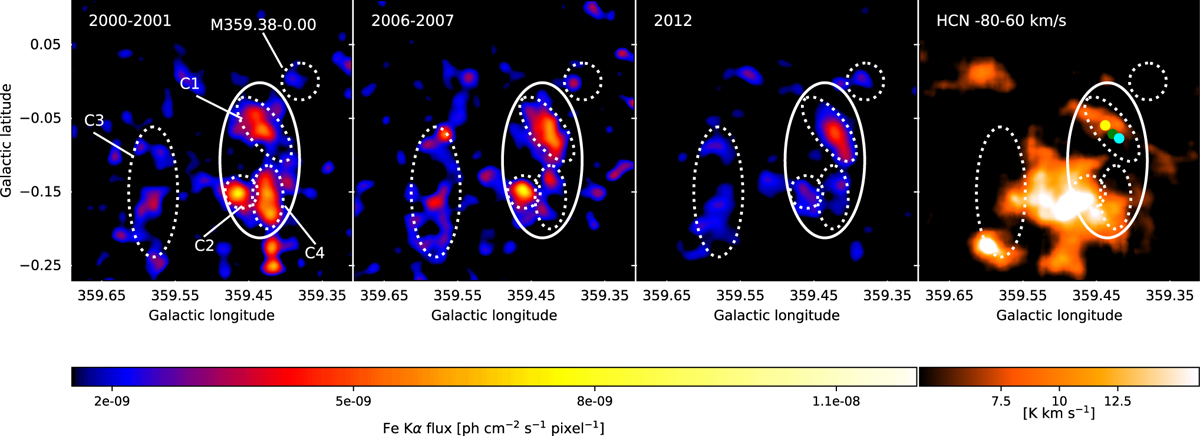
Fe Kα maps of the Sgr C complex for three periods of XMM-Newton observations (first three panels from the left) and Mopra HCN map integrated over the − 80 to − 60 km s−1 velocity band for the same region (right panel). The yellow, green, and cyan dots give the position of the centroid of the emission in the C1 region in 2000−2001, 2006−2007 and 2012, respectively. A displacement of 1.6′ of the emission in a direction similar to that of the molecular feature is visible. The Fe Kα maps are in units of ph cm−2 s−1 pixel−1, with 2.5″ pixel size, and smoothed using a Gaussian kernel of 8 pixels radius. The solid line region labelled Sgr C includes the bulk of the Fe Kα bright clumps, while the smaller regions reported by other papers plus the C4 clump newly labelled here are shown in dotted lines.
Current usage metrics show cumulative count of Article Views (full-text article views including HTML views, PDF and ePub downloads, according to the available data) and Abstracts Views on Vision4Press platform.
Data correspond to usage on the plateform after 2015. The current usage metrics is available 48-96 hours after online publication and is updated daily on week days.
Initial download of the metrics may take a while.