Fig. 1
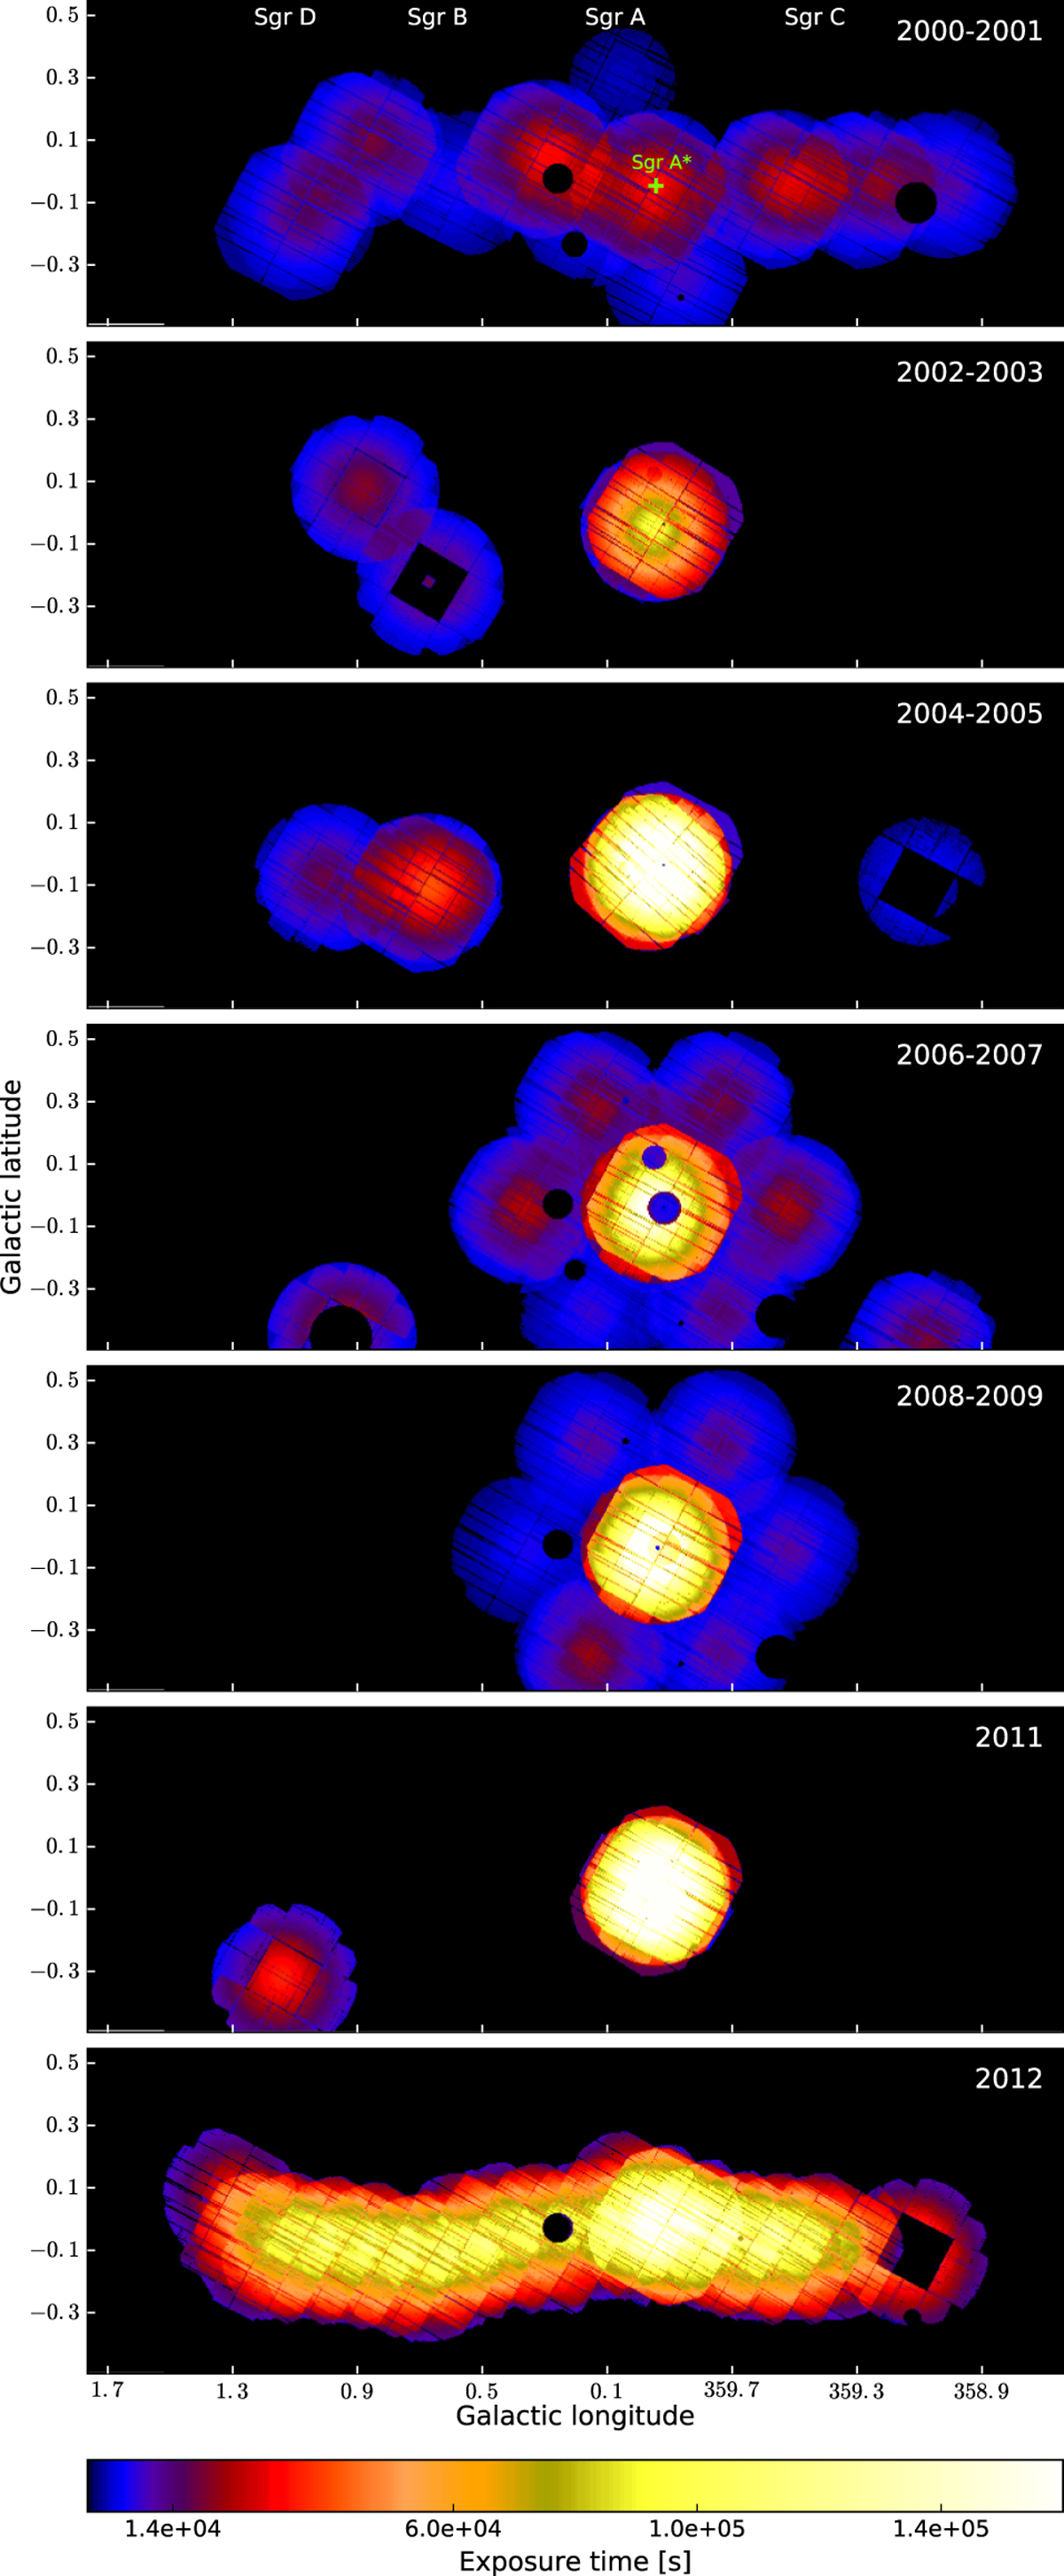
Time exposure maps for the 7 epochs in which the XMM-Newton data have been grouped (in units of seconds, with 2.5″ pixel size, and in Galactic coordinates) after applying the exposure time cuts discussed in Sect. 2.1. The darker circular regions correspond to the point sources that have been excluded (see the list in Table A.1). The MOS1 and MOS2 exposures have been rescaled to take into account the different MOS and PN effective areas in order to create the PN-equivalent exposure mosaics shown here.
Current usage metrics show cumulative count of Article Views (full-text article views including HTML views, PDF and ePub downloads, according to the available data) and Abstracts Views on Vision4Press platform.
Data correspond to usage on the plateform after 2015. The current usage metrics is available 48-96 hours after online publication and is updated daily on week days.
Initial download of the metrics may take a while.