Fig. 4
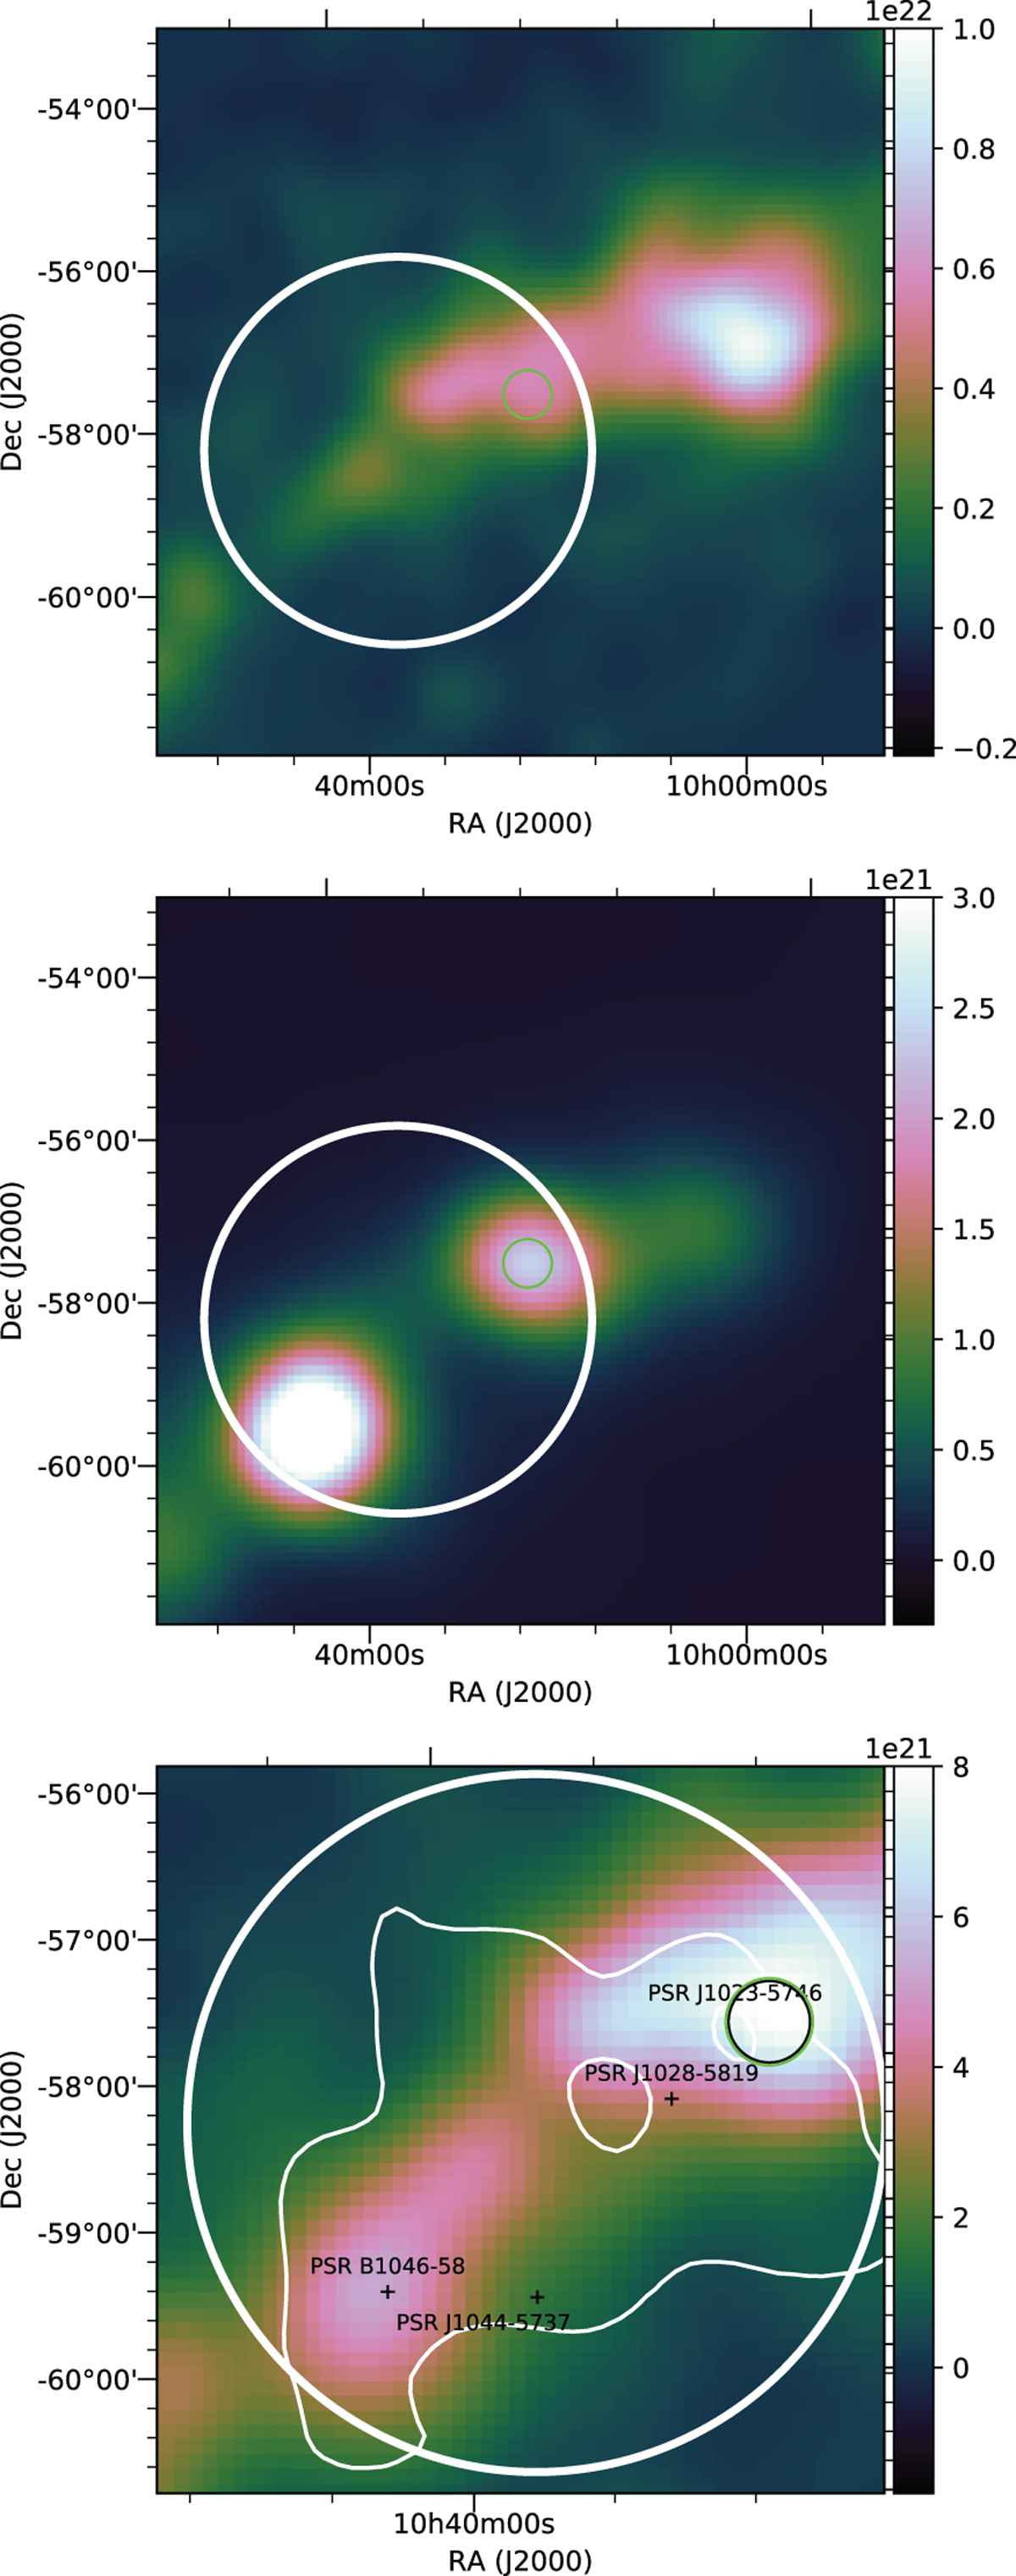
Top panel: gas column densities derived from CO data, integrated in the velocity range of [−11, 21] km s −1. Middle panel: H ii column density derived from the Planck free–free maps. Bottom panel: Total gas column density by summing up the molecular gas and H ii gas. The γ-ray emission is overlaid with white contours together with the positions of the energetic pulsars in the field and the position of Westerlund 2 (green circle). The white disk indicates the γ-ray template, in which the total gas mass is calculated.
Current usage metrics show cumulative count of Article Views (full-text article views including HTML views, PDF and ePub downloads, according to the available data) and Abstracts Views on Vision4Press platform.
Data correspond to usage on the plateform after 2015. The current usage metrics is available 48-96 hours after online publication and is updated daily on week days.
Initial download of the metrics may take a while.