Free Access
Fig. 3
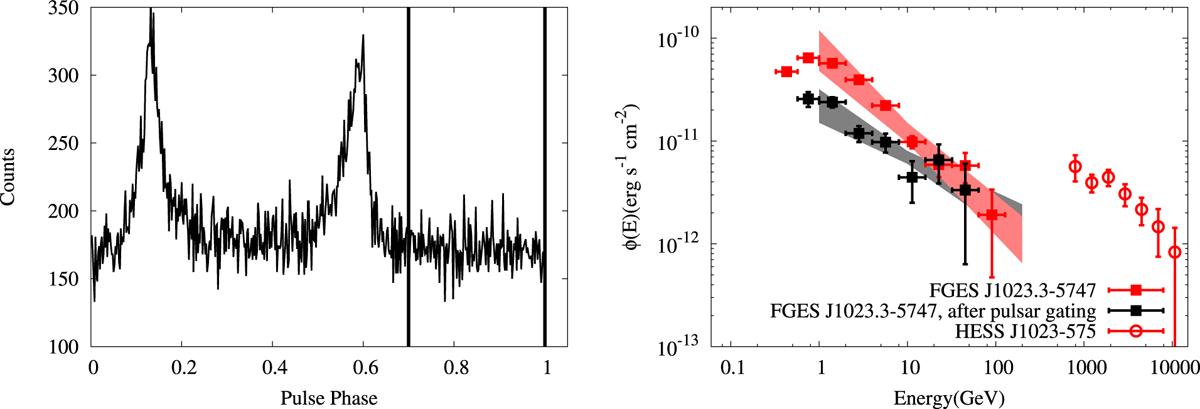
Left panel: phase-folded light curve of pulsar PSR J1022–5746. The two vertical lines indicate the interval in which we selected in the pulsar gating analysis. Right panel: SEDs derived both before (red squares) and after (black squares) pulsar gating. Also shown is the H.E.S.S. data of HESS J1023–575 (red open circles).
Current usage metrics show cumulative count of Article Views (full-text article views including HTML views, PDF and ePub downloads, according to the available data) and Abstracts Views on Vision4Press platform.
Data correspond to usage on the plateform after 2015. The current usage metrics is available 48-96 hours after online publication and is updated daily on week days.
Initial download of the metrics may take a while.