Fig. 1
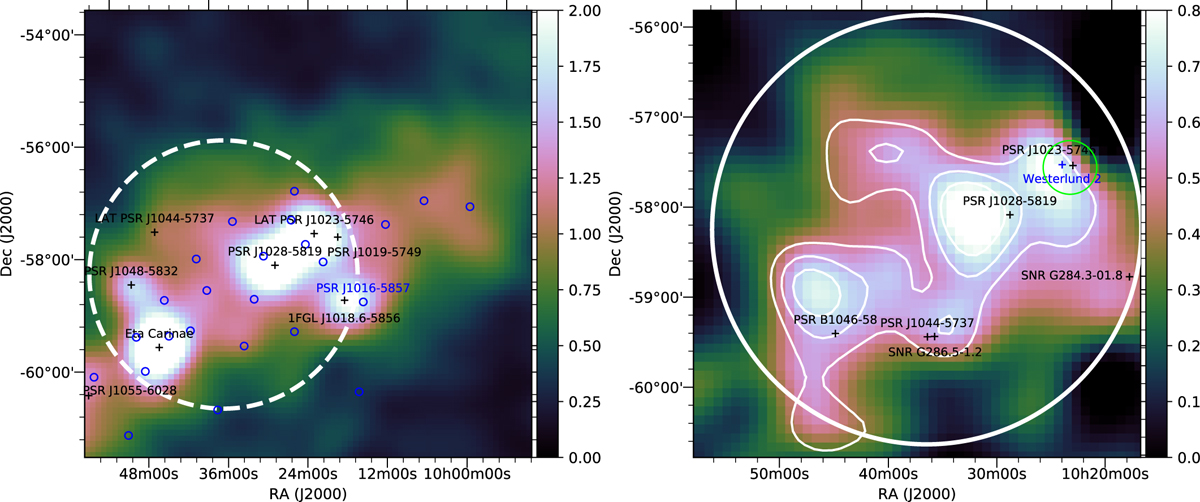
Left panel: γ-rays count map above 10 GeV in the 8° × 8° region around Westerlund 2. The 3FGL catalogue sources are labelled with a black cross and blue circle for identified and unassociated sources, respectively. The white dashed line shows the extended emission related to FGES J1036.4–5834. Right panel: residual map after subtracting all the identified catalogue source and the diffuse background, centred on the best-fit position of the extended source to the south of Westerlund 2. Also shown are the best-fit 2D disk template (white circle), the position and extension of FGES J1023–5746 (green circle), and the known SNRs and bright pulsars in the field of view. The blue cross labels the position of the star cluster Westerlund 2. The white contours are obtained from the TS-map, for levels 3, 4, and 5.
Current usage metrics show cumulative count of Article Views (full-text article views including HTML views, PDF and ePub downloads, according to the available data) and Abstracts Views on Vision4Press platform.
Data correspond to usage on the plateform after 2015. The current usage metrics is available 48-96 hours after online publication and is updated daily on week days.
Initial download of the metrics may take a while.