Fig. 8
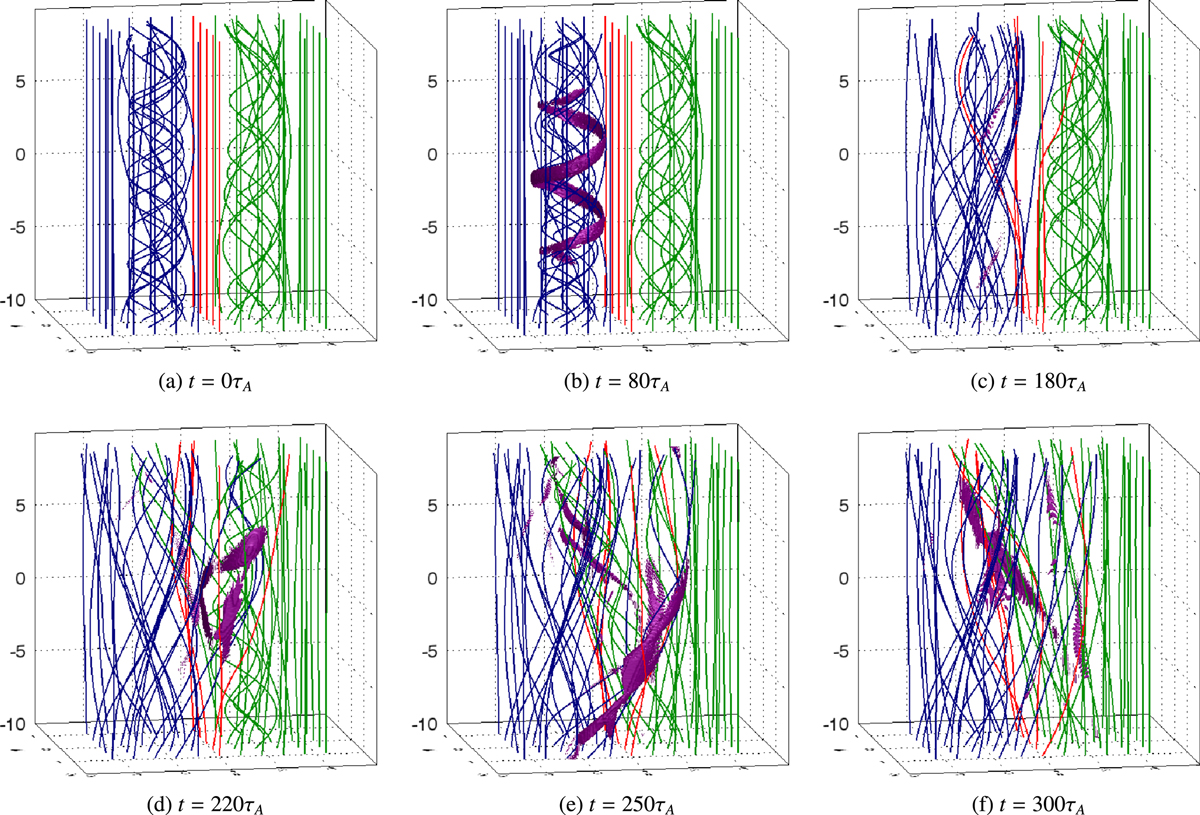
Interacting loops: images show specific
interpolated magnetic field lines (traced
from the base of the simulation domain, at
![]() in non-dimensional units), colour-coded by location in
in non-dimensional units), colour-coded by location in
![]() ,
at different stages of the experiment. Blue
field lines are traced from regions where
,
at different stages of the experiment. Blue
field lines are traced from regions where
![]() ,
red field lines are traced from
,
red field lines are traced from
![]() only, while green field lines are traced from
only, while green field lines are traced from
![]() .
Thus (prior to any reconnection) blue field lines are
initially associated with the left-hand flux tube and green
field lines with the right-hand tube, separated by red field
lines. Purple isosurfaces (where present) indicate regions
of current above the critical value.
.
Thus (prior to any reconnection) blue field lines are
initially associated with the left-hand flux tube and green
field lines with the right-hand tube, separated by red field
lines. Purple isosurfaces (where present) indicate regions
of current above the critical value.
Current usage metrics show cumulative count of Article Views (full-text article views including HTML views, PDF and ePub downloads, according to the available data) and Abstracts Views on Vision4Press platform.
Data correspond to usage on the plateform after 2015. The current usage metrics is available 48-96 hours after online publication and is updated daily on week days.
Initial download of the metrics may take a while.