Fig. 7
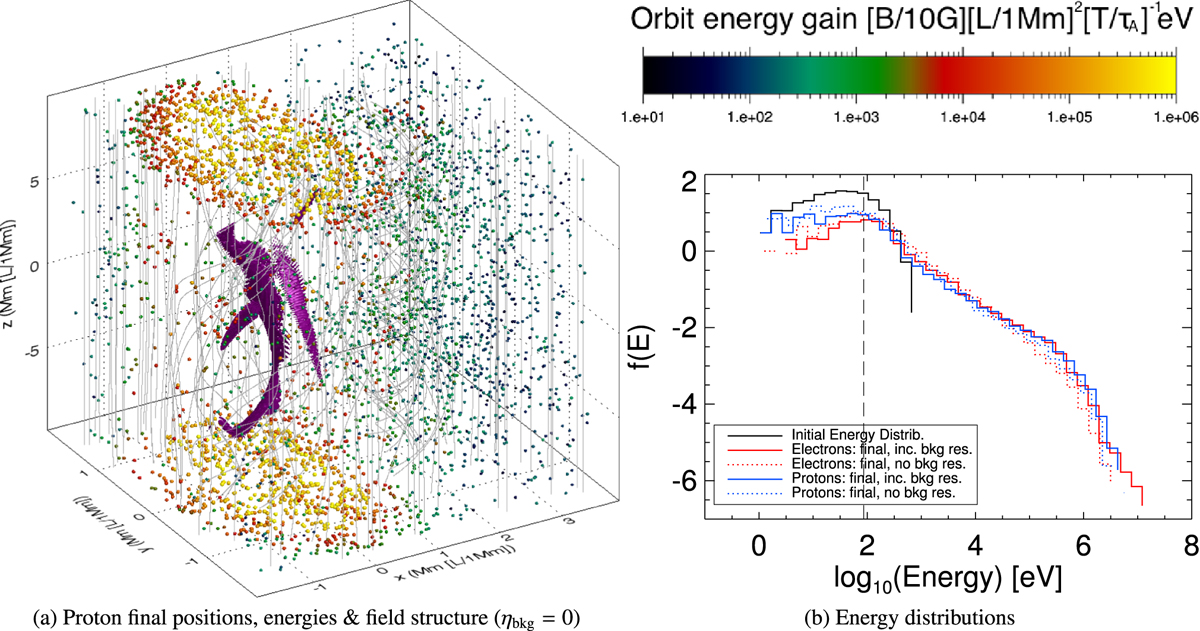
Single thread destabilises, Phase 3. Panel a: final positions and energies of protons (for the case where background resistivity is omitted from every orbit calculation)together with purple isosurface(s) of critical current and interpolated magnetic field lines (grey). The key to orbit energies is given in the colour bar displayed above panel b, where the initial and final energy distributions of both electrons (red) and protons (blue) are displayed, for cases where background resistivity is omitted (dashed) or included (solid lines), while the black solid histogram shows an example of the initial energy distribution.
Current usage metrics show cumulative count of Article Views (full-text article views including HTML views, PDF and ePub downloads, according to the available data) and Abstracts Views on Vision4Press platform.
Data correspond to usage on the plateform after 2015. The current usage metrics is available 48-96 hours after online publication and is updated daily on week days.
Initial download of the metrics may take a while.