Fig. 5
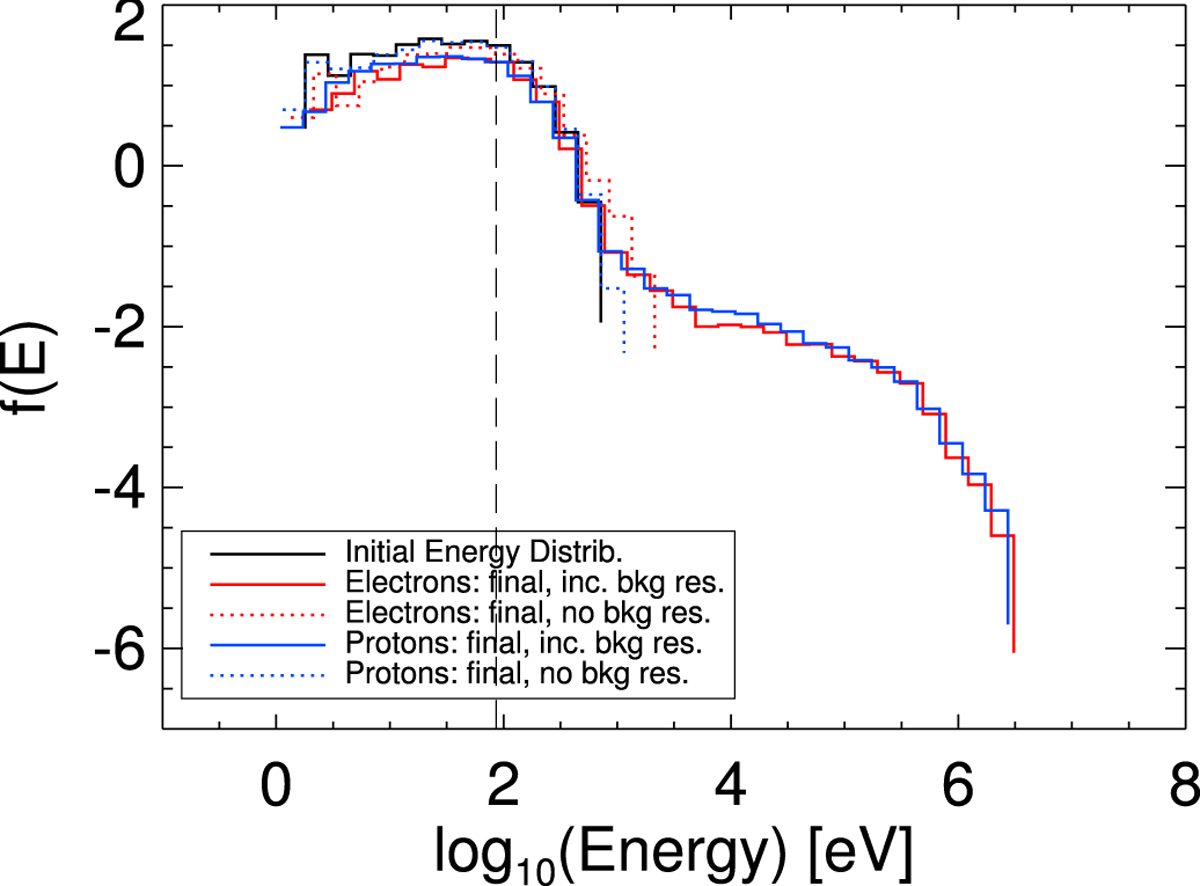
Single thread destabilises, Phase 1. Final energy distributions for both electron (red) and proton (blue) orbit calculations during this phase, with the calculations either including (solid lines) or omitting (dotted lines) the effects of background resistivity. An example of the initial energy distribution used by either species can be seen as the black solid histogram.
Current usage metrics show cumulative count of Article Views (full-text article views including HTML views, PDF and ePub downloads, according to the available data) and Abstracts Views on Vision4Press platform.
Data correspond to usage on the plateform after 2015. The current usage metrics is available 48-96 hours after online publication and is updated daily on week days.
Initial download of the metrics may take a while.