Fig. 13
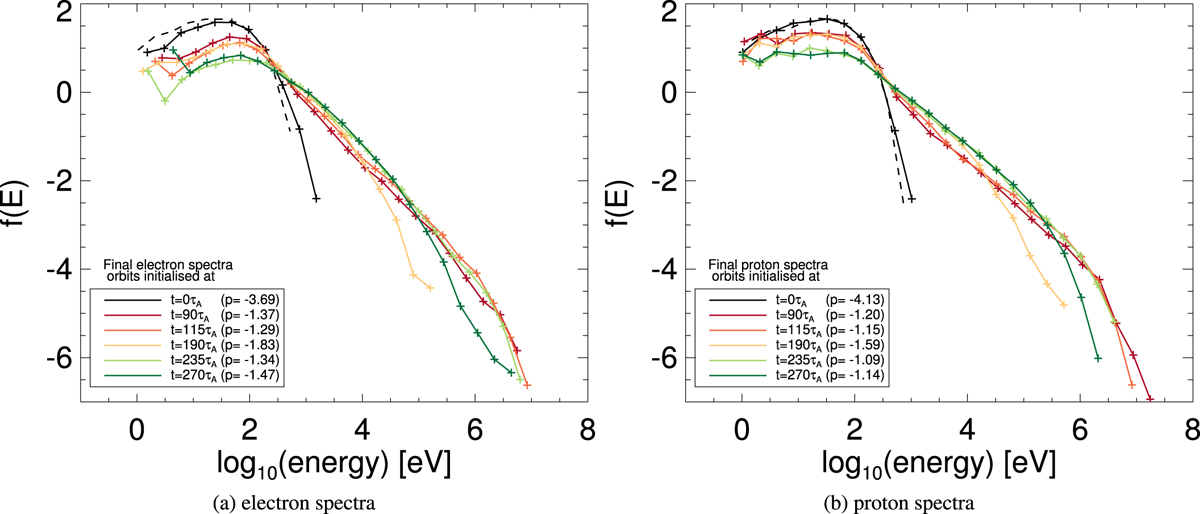
Interacting loops: temporal evolution of final energy spectra of electrons (panel a) and protons (panel b), initiated at different snapshots during MHD experiment (where the fragmentation of one flux tube destabilises a second tube). An initial energy spectrum is seen as a dashed histogram, while the coloured spectra represent the final energies for orbits started at different times. A power law has been fit to each spectra between 100 eV and 1 MeV, with the power law index (p) and initiation time of each spectra given in the legend.
Current usage metrics show cumulative count of Article Views (full-text article views including HTML views, PDF and ePub downloads, according to the available data) and Abstracts Views on Vision4Press platform.
Data correspond to usage on the plateform after 2015. The current usage metrics is available 48-96 hours after online publication and is updated daily on week days.
Initial download of the metrics may take a while.