Fig. 8
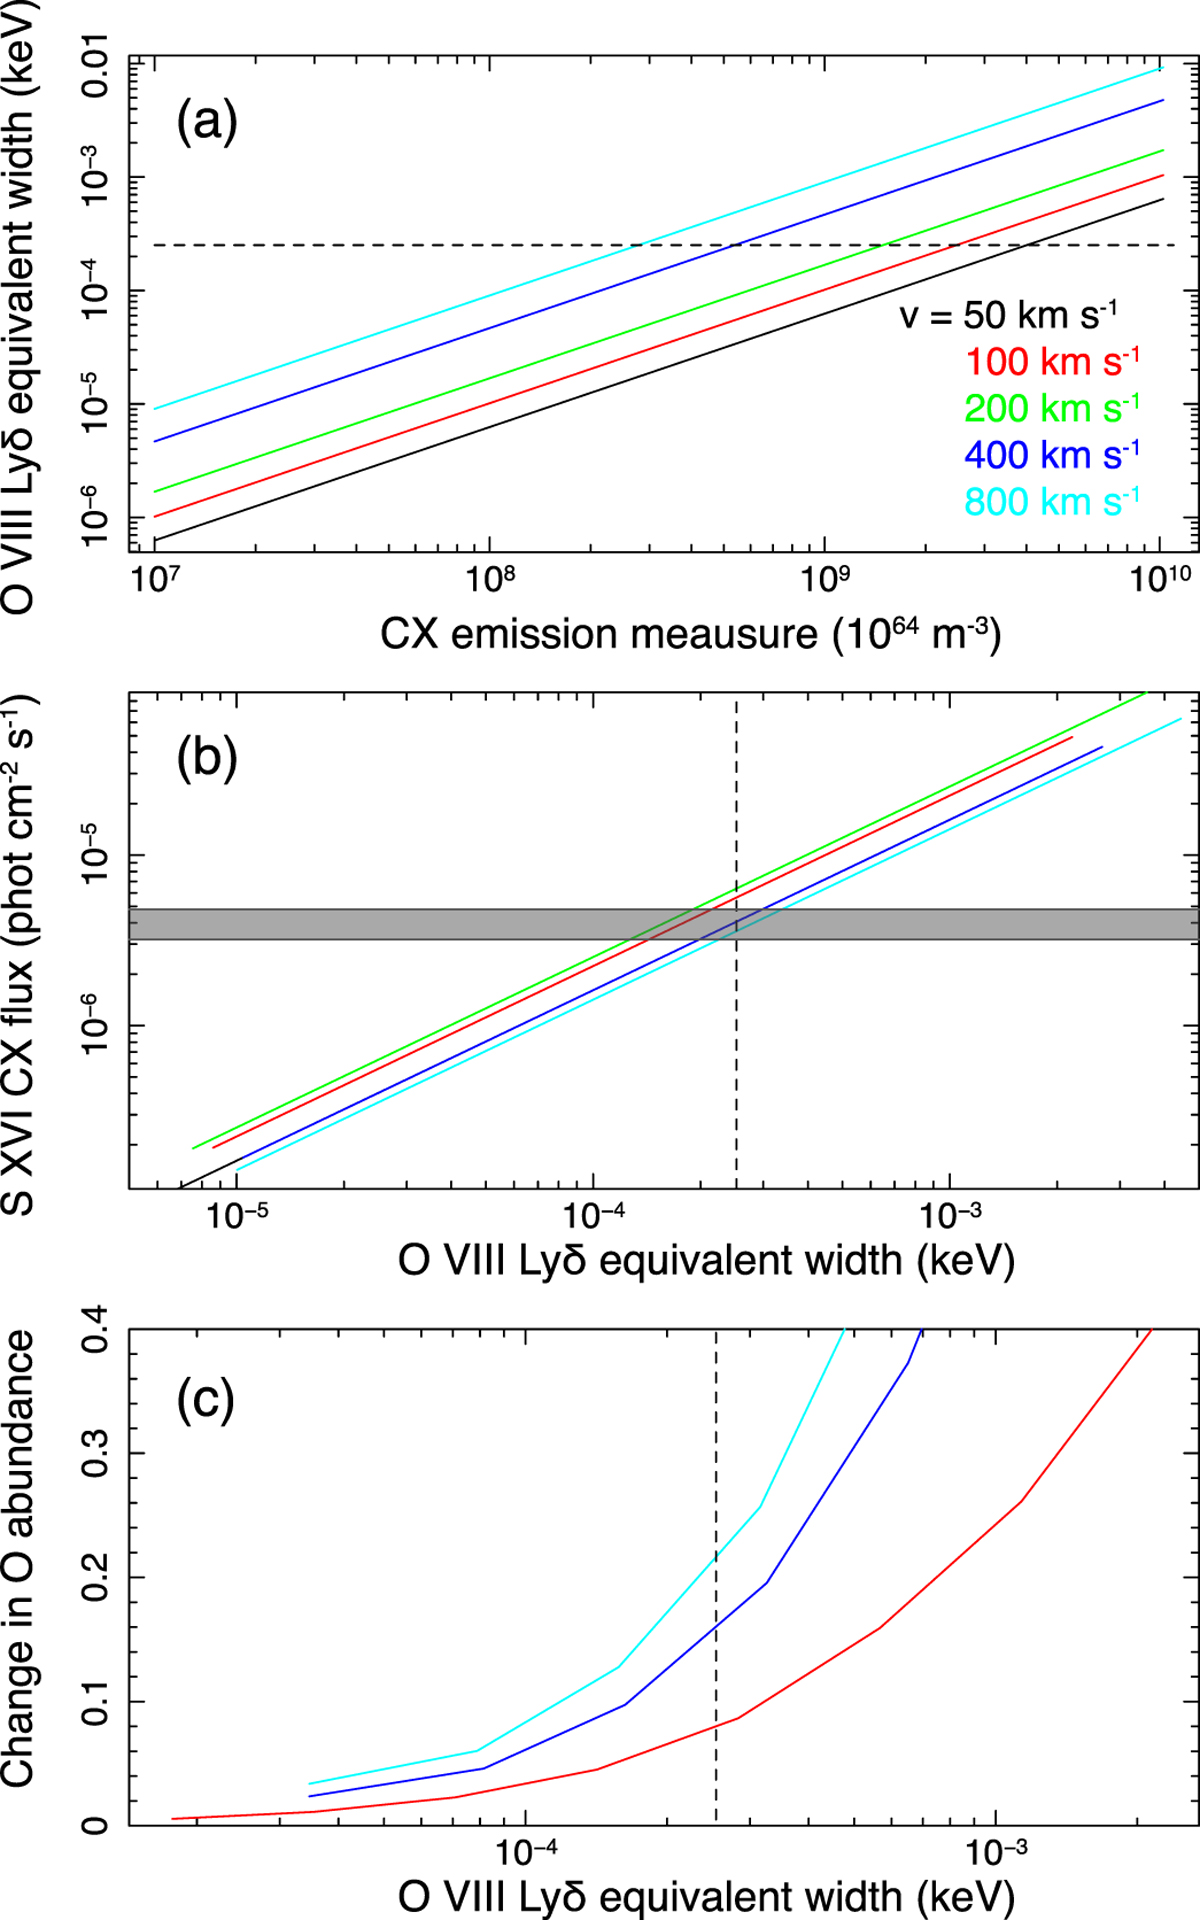
Panel a: equivalent width of the O VIII Lyδ line as a function of the CX emission measure for different collision velocities, calculated based on the cx model in SPEX. The background thermal component is taken from the best-fit two-temperature model for Abell 85. The observed sample-averaged equivalent width is shown by a dashed line in all panels. Panel b: model calculation of S XVI CX line flux at ~3.5 keV as a function of O VIII Lyδ equivalent width. The shadow region shows the observed flux of the unidentified 3.5 keV line in Bulbul et al. (2014). Panel c: fractional change in oxygen abundance as a function of O VIII Lyδ equivalent width. The color schemes in panels b and c are the same as in panel a.
Current usage metrics show cumulative count of Article Views (full-text article views including HTML views, PDF and ePub downloads, according to the available data) and Abstracts Views on Vision4Press platform.
Data correspond to usage on the plateform after 2015. The current usage metrics is available 48-96 hours after online publication and is updated daily on week days.
Initial download of the metrics may take a while.