Fig. 7
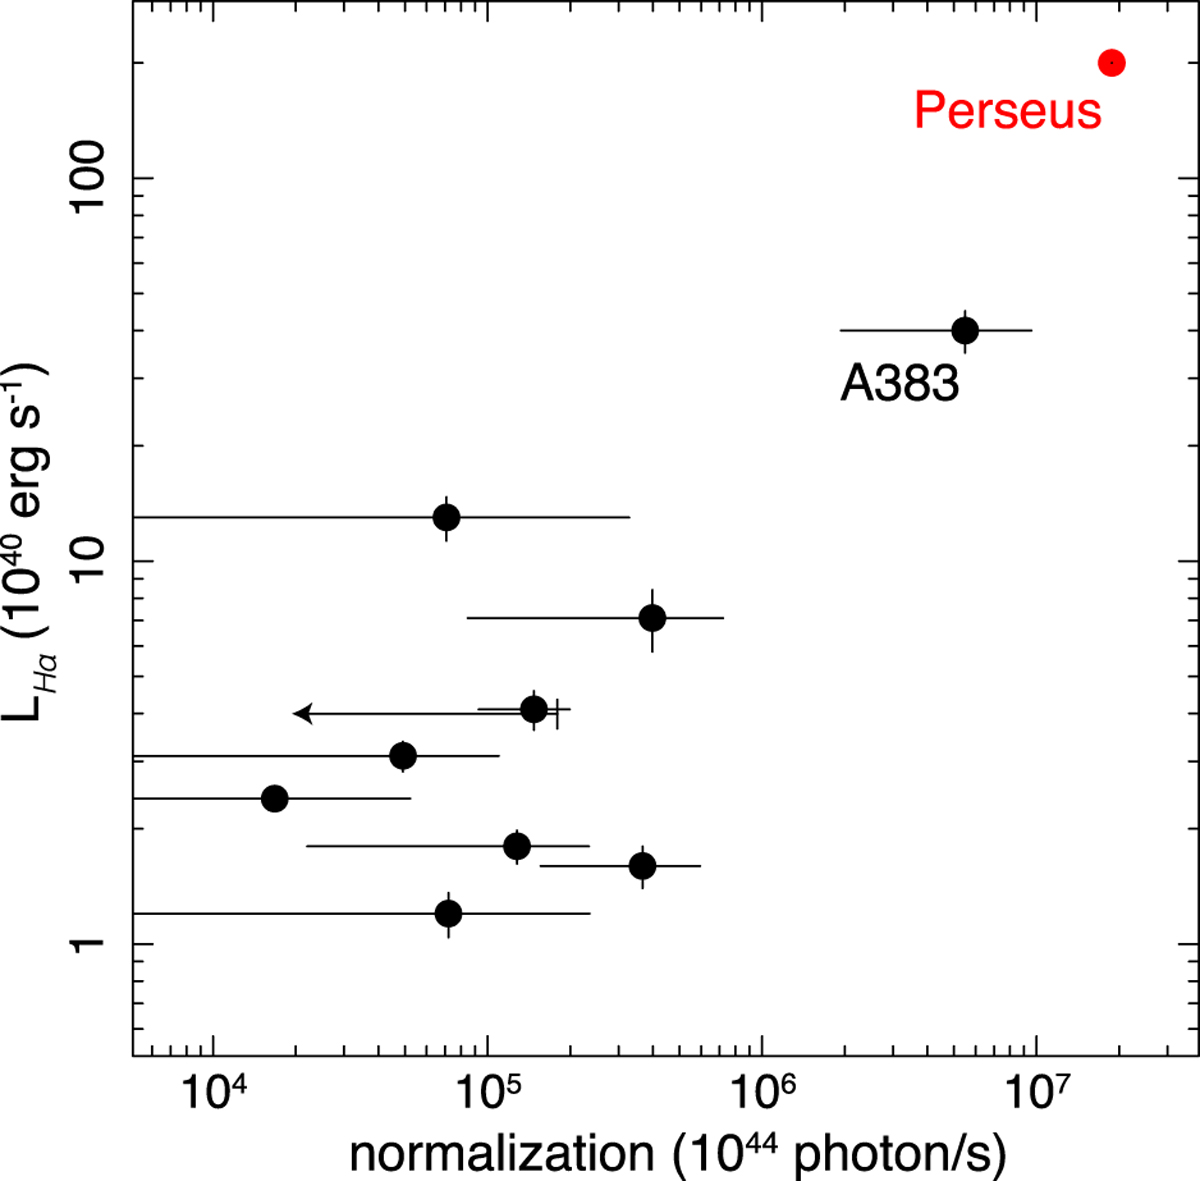
Measured normalizations of the Gaussian line at 14.82 Å plotted against the Hα line luminosities taken from Hamer et al. (2016). As a reference, we also plot the expected O VIII Lyδ line strength for the Perseus cluster, estimated based on the CX model that best fits the Hitomi data (Hitomi Collaboration et al., in prep.). A solar abundance ratio is assumed since the Hitomi spectrum does not cover the oxygen band. The Hα luminosity of the Perseus cluster is taken from Conselice et al. (2001).
Current usage metrics show cumulative count of Article Views (full-text article views including HTML views, PDF and ePub downloads, according to the available data) and Abstracts Views on Vision4Press platform.
Data correspond to usage on the plateform after 2015. The current usage metrics is available 48-96 hours after online publication and is updated daily on week days.
Initial download of the metrics may take a while.