Fig. 4
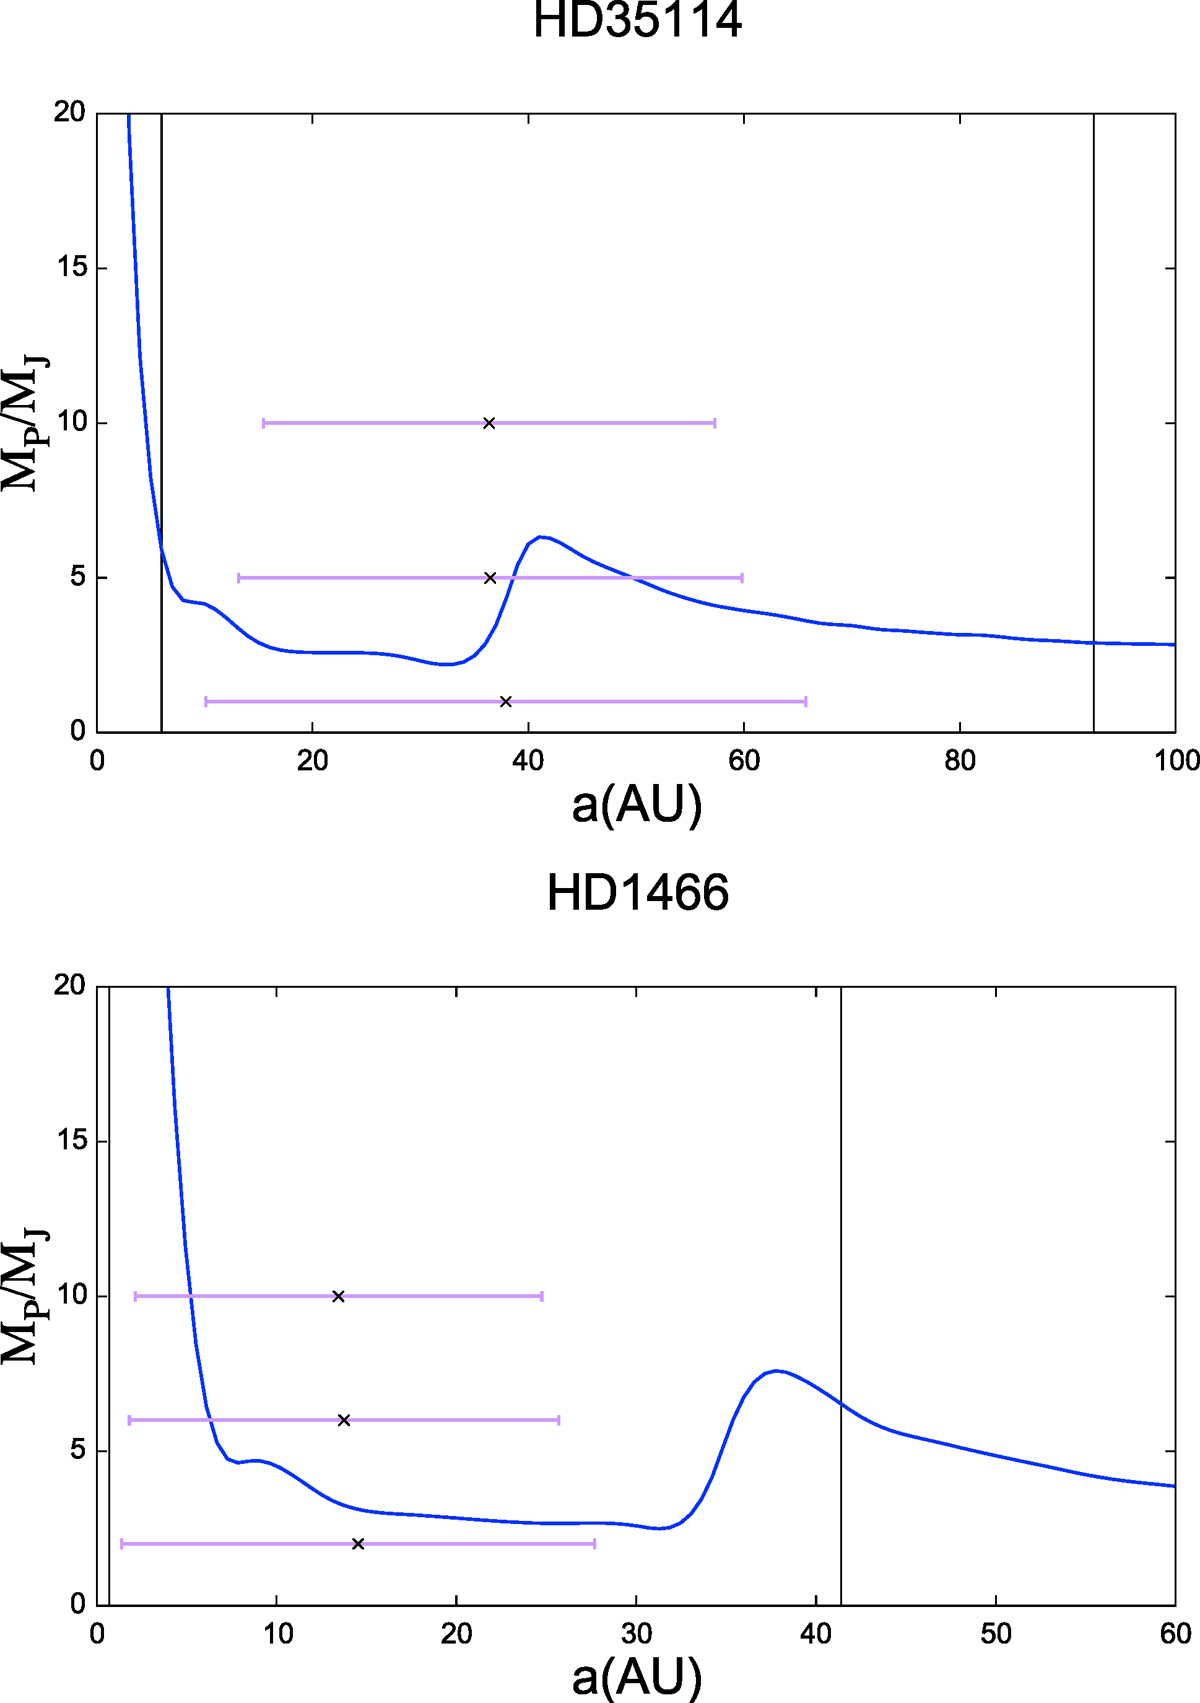
SPHERE detection limits for HD 35114 (up) and HD 1466 (down). The bar plotted for each Mp represents the interval of distances covered by the planet during its orbit, from a minimum distance (periastron) to the maximum one (apoastron) from the star. The two vertical black lines represent the positions of the two belts. Projection effects in the case of significantly inclined systems are not included.
Current usage metrics show cumulative count of Article Views (full-text article views including HTML views, PDF and ePub downloads, according to the available data) and Abstracts Views on Vision4Press platform.
Data correspond to usage on the plateform after 2015. The current usage metrics is available 48-96 hours after online publication and is updated daily on week days.
Initial download of the metrics may take a while.