Fig. A.1
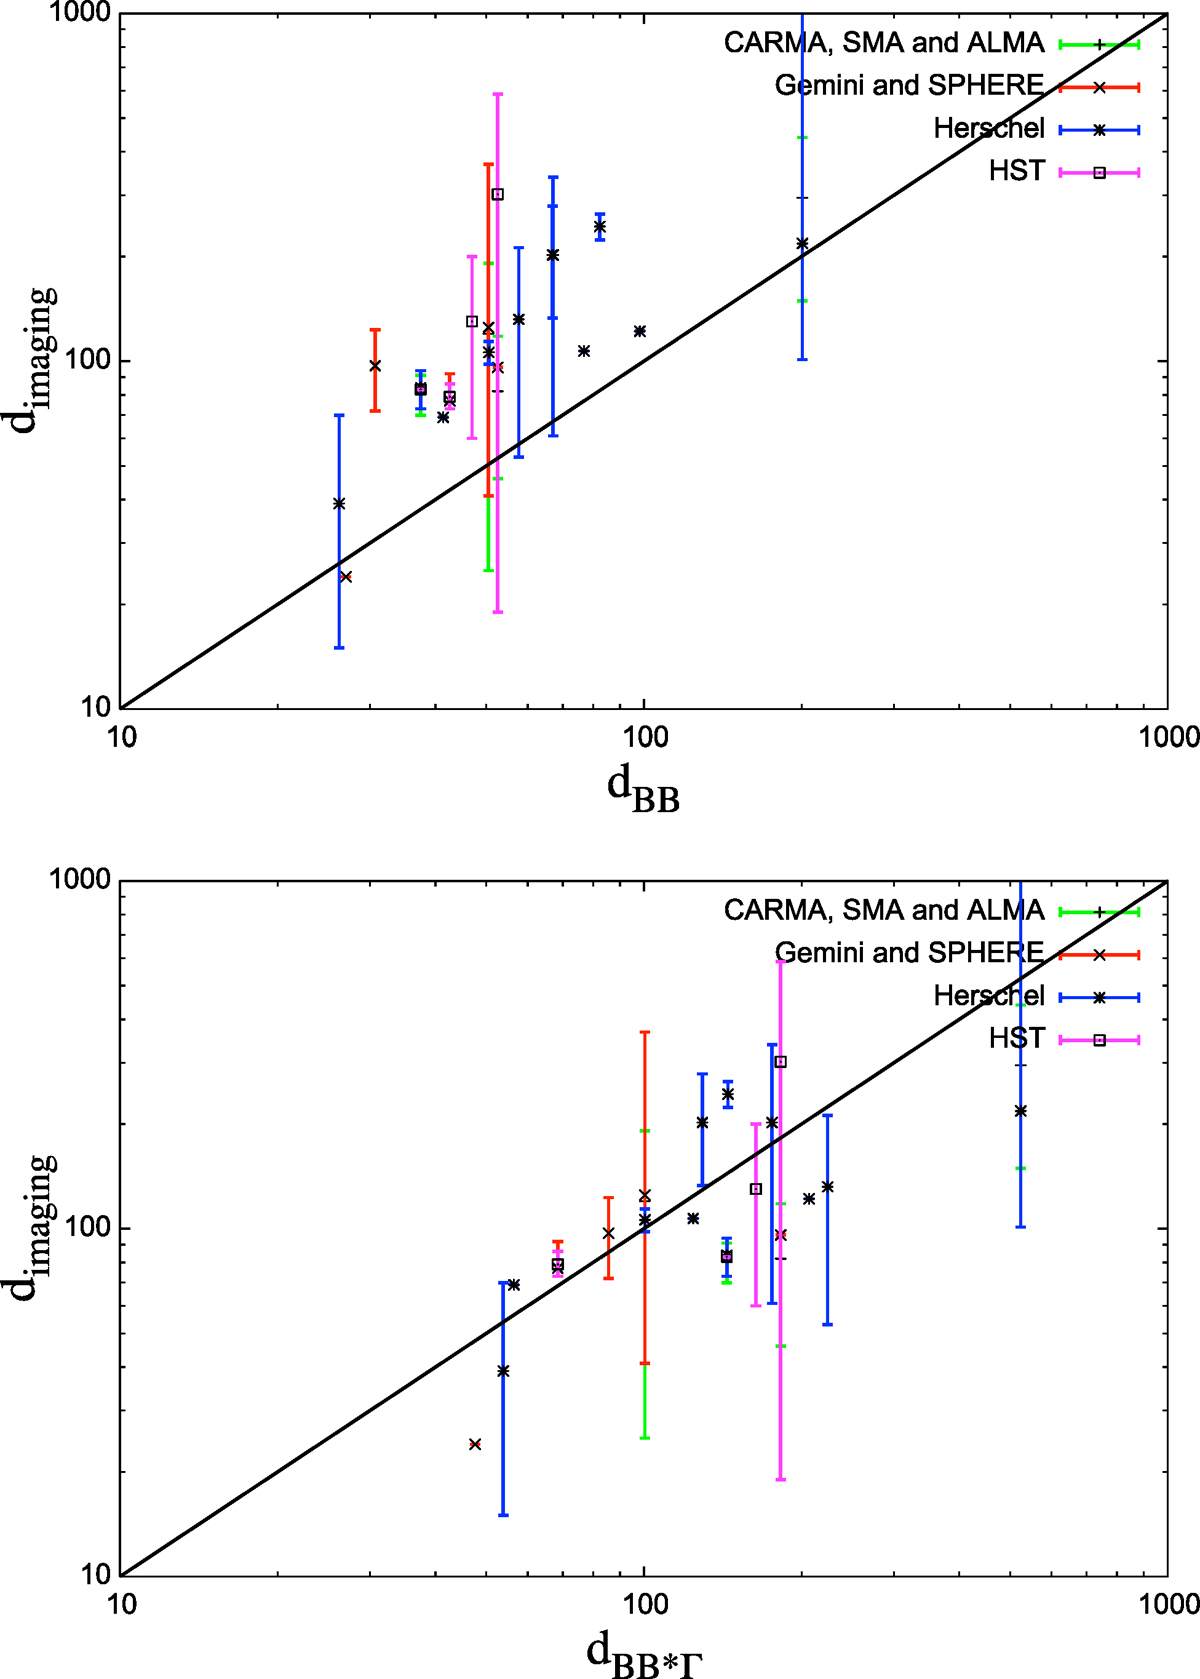
Position of the outer belts as obtained from SED analysis with hypothesis of blackbody (above) and with correction factor Γ (beneath) vs. positions obtained from resolved images. The black line represents the bisector, that is, when the two positions coincide. The vertical error bars represent instead the extension of the disk from its inner edge to its outer one.
Current usage metrics show cumulative count of Article Views (full-text article views including HTML views, PDF and ePub downloads, according to the available data) and Abstracts Views on Vision4Press platform.
Data correspond to usage on the plateform after 2015. The current usage metrics is available 48-96 hours after online publication and is updated daily on week days.
Initial download of the metrics may take a while.