Fig. 7
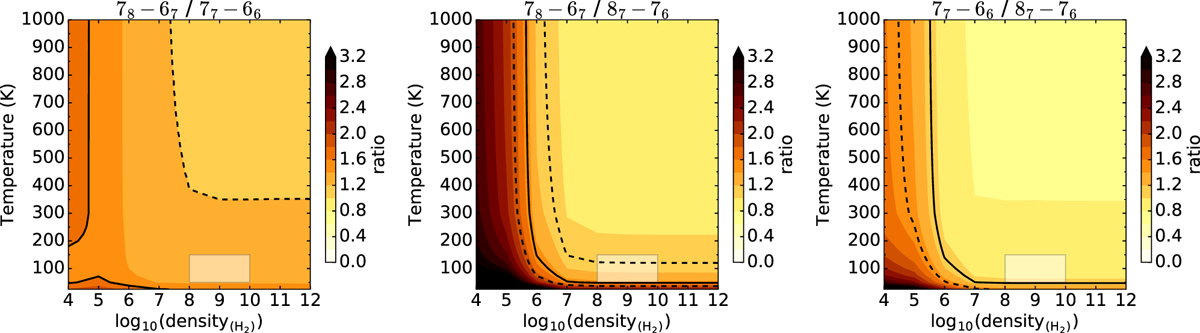
RADEX modelling results of the selected SO line ratios. From left to right are the three ratios: J = 78 –67/J = 77–66, J = 78 –67/J = 87–76 and J = 77–66/J = 87–76. The solid black line is the observed line ratio and the dotted black lines are the error bars. The shaded region highlights the temperature and density conditions chosen for the location of the SO in the LIME modelling.
Current usage metrics show cumulative count of Article Views (full-text article views including HTML views, PDF and ePub downloads, according to the available data) and Abstracts Views on Vision4Press platform.
Data correspond to usage on the plateform after 2015. The current usage metrics is available 48-96 hours after online publication and is updated daily on week days.
Initial download of the metrics may take a while.