Fig. 5
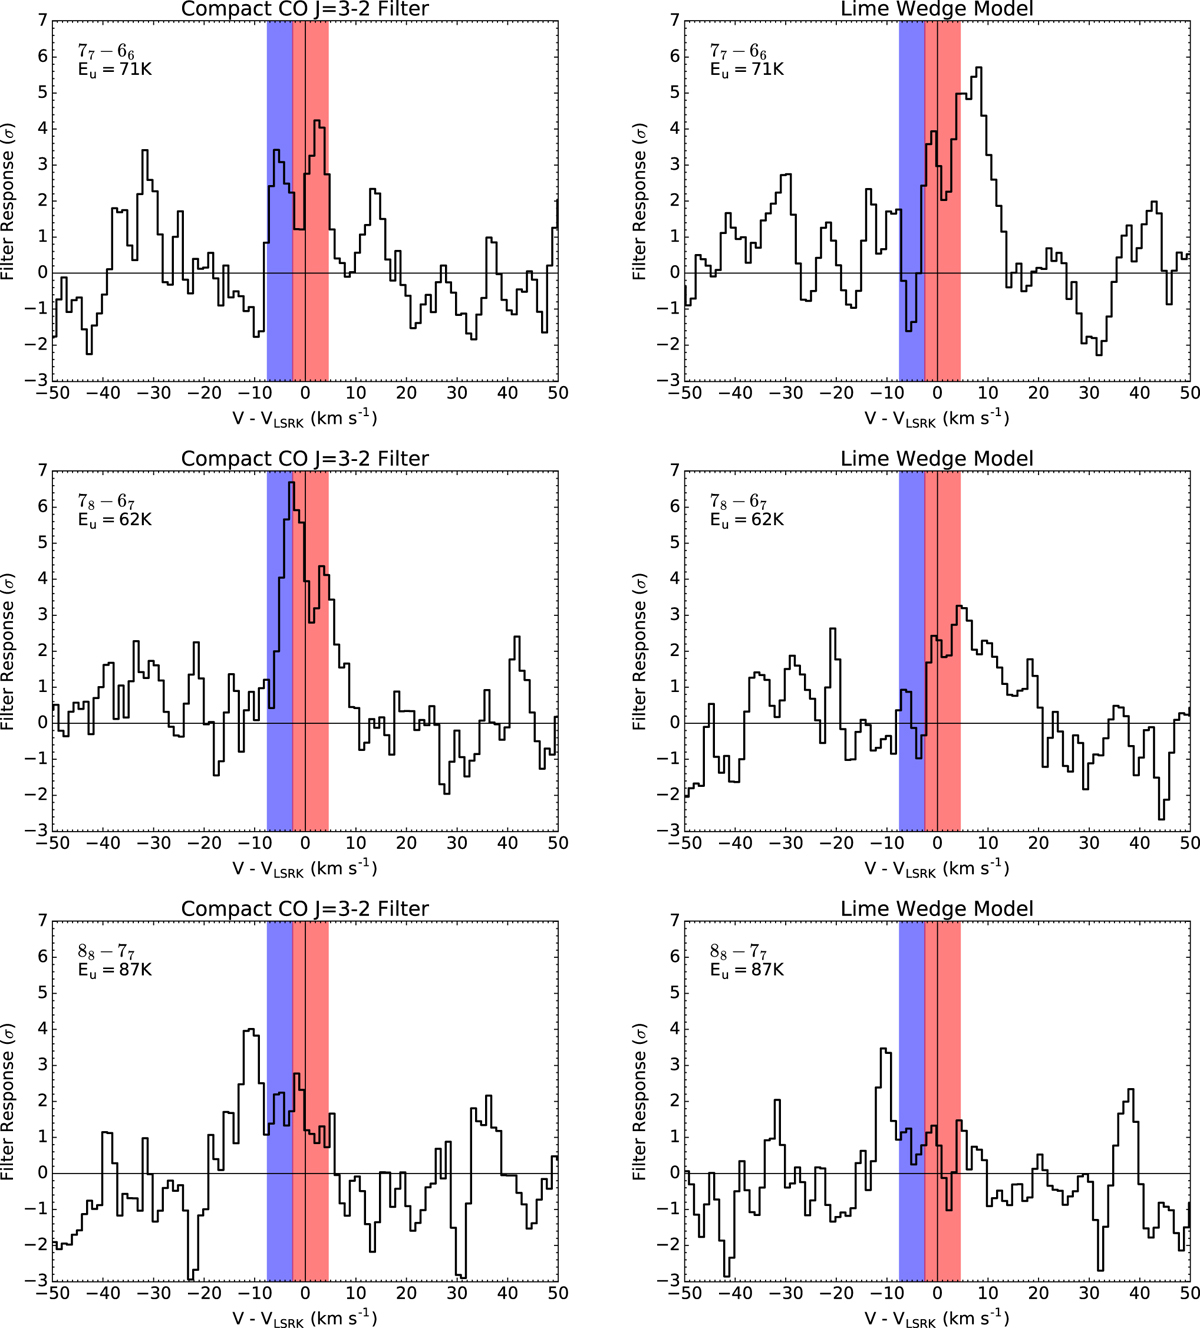
Matched filter responses for the three detected SO transitions. Left: results using a spatially compact (1/4) version of the CO channel maps as a filter. Right: results using the best fit LIME wedge model as a filter (see Sect. 5 for details). Highlighted in red and blue are the velocity ranges of emission we attribute to a disk and a wind component respectively.
Current usage metrics show cumulative count of Article Views (full-text article views including HTML views, PDF and ePub downloads, according to the available data) and Abstracts Views on Vision4Press platform.
Data correspond to usage on the plateform after 2015. The current usage metrics is available 48-96 hours after online publication and is updated daily on week days.
Initial download of the metrics may take a while.