| Issue |
A&A
Volume 611, March 2018
|
|
|---|---|---|
| Article Number | A28 | |
| Number of page(s) | 14 | |
| Section | Extragalactic astronomy | |
| DOI | https://doi.org/10.1051/0004-6361/201731074 | |
| Published online | 19 March 2018 | |
Hα imaging observations of early-type galaxies from the ATLAS3D survey★,★★
1
Università degli Studi di Milano-Bicocca,
Piazza della Scienza 3,
20126
Milano, Italy
e-mail: This email address is being protected from spambots. You need JavaScript enabled to view it.
2
Max-Planck-Institut für Extraterrestrische Physik,
Giessenbachstrasse,
85748
Garching, Germany
e-mail: This email address is being protected from spambots. You need JavaScript enabled to view it.
3
Universitäts-Sternwarte München,
Schenierstrasse 1,
81679 München, Germany
4
Institute for Computational Cosmology, and Centre for Extragalactic Astronomy, Durham University,
South Road,
Durham
DH1 3LE, UK
e-mail: This email address is being protected from spambots. You need JavaScript enabled to view it.
5
Aix Marseille Université, CNRS, LAM (Laboratoire d’Astrophysique de Marseille)
UMR 7326,
13388
Marseille, France
Received:
30
April
2017
Accepted:
14
September
2017
Abstract
Context. The traditional knowledge of the mechanisms that brought to the formation and evolution of early type galaxies (ETG) in a hierarchical Universe was challenged by the unexpected finding by ATLAS3D that 86% ETGs show signs of a fast rotating disk at their interior, implying an origin common to most spiral galaxies, followed by a quenching phase, while only a minority of the most massive systems are slow rotators and were likely to be the products of merger events.
Aims. Our aim is to improve our knowledge on the content and distribution of ionised hydrogen and their usage to form stars in a representative sample of ETGs for which the kinematics and detailed morphological classification were known from ATLAS3D.
Methods. Using narrow-band filters centered on the redshifted Hα line along with a broad-band (r-Gunn) filter to recover the stellar continuum, we observed or collected existing imaging observations for 147 ETG (including members of the Virgo cluster), representative of the whole ATLAS3D survey.
Results. 55 ETGs (37%) were detected in the Hα line above our detection threshold (HαEW ≤ −1 Å) and 21 harbour a strong source (HαEW ≤ −5 Å) .
Conclusions. The strong Hα emitters appear associated with mostly low-mass (M* ~ 1010 M⊙) S0 galaxies which contain conspicuous stellar and gaseous disks, harbouring significant star formation at their interior, including their nuclei. The weak Hα emitters are almost one order of magnitude more massive, contain gas-poor disks and harbour an AGN at their centers. Their emissivity is dominated by [NII] and does not imply star formation. The 92 undetected ETGs constitute the majority in our sample and are gas-free systems which lack a disk and exhibit passive spectra even in their nuclei. These pieces of evidence reinforce the conclusion of Cappellari (2016, ARA&A, 54, 597) that the evolution of ETGs followed the secular channel for the less massive systems and the dry merging channel for the most massive galaxies at the center of clusters of galaxies.
Key words: Galaxy: evolution / galaxies: / fundamental parameters / galaxies: star formation
Based on observations taken at the Mexican Observatorio Astronomico Nacional and at the Loiano telescope belonging to the Bologna Observatory.
Tables A.1–A.6 are only available at the CDS via anonymous ftp to cdsarc.u-strasbg.fr (130.79.128.5) or via http://cdsarc.u-strasbg.fr/viz-bin/qcat?J/A+A/611/A28
© ESO 2018
1 Introduction
Our understanding of the processes that brought to the formation of galaxies and their subsequent evolution must cope with the observational evidence that, today, galaxies are distributed in a bimodal population (Kauffmann et al. 2003a; Balogh et al. 2004; Baldry et al. 2004): the blue cloud, composed of star forming, gas-rich, disky systems and the red sequence made of quiescent, gas-poor “red and dead” galaxies. Galaxies supposedly migrate from the star forming blue cloud to the red sequence owing to a variety of quenching mechanisms. It is common belief that in a hierarchical Universe the main process that brought early-type galaxies (ETGs) across the green valley was merging of disky systems (late-type galaxies, hereafter LTGs). These catastrophic events should have dissipated angular momentum of the pre-merging LTGs, producing non- or slowly rotating elliptical, dispersion dominated galaxies.
However, until the advent of integral field spectrographs, the fraction of true ellipticals (i.e. slow rotators, the outcome of mergers) could only be deduced by the optical morphology of galaxies without any knowledge of the stellar kinematics. Owing to the SAURON IFU spectrograph, the recent ATLAS3D survey (Cappellari et al. 2011a) derived resolved stellar kinematic maps of 260 ETGs and studied for the first time the kinematic morphology–density relation using fast and slow rotators instead of ellipticals (E) and lenticulars (S0) (Cappellari et al. 2011b). The survey showed that ETGs are dominated (86%) by fast rotators up to intermediate stellar masses (Emsellem et al. 2011), and from the lowest density environments up to the dense core of the Virgo cluster where only a small increase of the fraction of slow rotators is found. True ellipticals (i.e. slow rotators) are only found among the most massive ETGs and have always ellipticity lower than 0.4 while lenticulars (i.e., fast rotators) are less massive galaxies and span all different possible ellipticities (Cappellari 2016). This new evidence challenged the paradigm stating that most ETGs are mainly created by merging events and opened to a revision of the classic tuning fork scheme that includes the kinematic information and where the fast rotators (namely S0s) follow a sequence parallel to spirals. The final outcome of the ATLAS3D survey can be summarised with Cappellari’s (2016) own words: “…Fast-rotator ETGs start as star-forming disks and evolve through a channel dominated by gas accretion, bulge growth, and quenching, whereas slow rotators assemble near the centers of massive halos via intense star formation at high redshift and remain as such for the rest of their evolution via a channel dominated by gas poor mergers…”. The dichotomy in stellar mass between the fast rotators and the more massive slow rotators has also been reproduced in recent simulations (Bois et al. 2011; Penoyre et al. 2017) and was reinforced by the findings of even more recent surveys such as the MASSIVE survey (Veale et al. 2017) that demonstrates that only the most massive ETGs (M* ~ 1011.5 M⊙) are true slow-rotators, and perhaps the only genuine outcomes of equal-mass merger events. These ETGs represent the majority of central massive haloes, such as cD galaxies in clusters of galaxies. On the other hand less massive fast rotators, which represent the vast majority of ETGs, likely emerge from less tragic evolutionary paths that leave them enough angular momentum to be rotation supported.
Hence, beside mergers (Kauffmann et al. 1993), other secular (e.g.bar instability, Gavazzi et al. 2015) and environmental processes (Boselli & Gavazzi 2006, 2014) need to be invoked to explain the way the color–luminosity plane is populated. Which processes brought to the migration of galaxies across the green valley (perhaps in both directions; Yıldız et al. 2017) is still matter of debate. To try settling this controversy, many lines of research were undertaken, focused on understanding the processes that govern the efficiency of transformation of gas (HI and H2) into stars, as a function of stellar mass, morphology and environment. Ongoing surveys that exploit integral field spectroscopy, such as CALIFA (Sánchez et al. 2012), SAMI (Bryant et al. 2015), and MaNGA (Belfiore et al. 2016) are about to provide us with spatially resolved diagnostic diagrams that will eventually contribute to solving the current controversy.
As the SAURON IFU does not include the Hα line in its bandpass we decided to investigate in this work the ionised hydrogen content of ETGs that were selected by ATLAS3D by means of imaging observations taken through narrow-band (80 Å) filters, combined with a spectroscopic investigation of their nuclear activity. To this end we combine existing spectroscopy (for the most part from Ho et al. 1995 and from SDSS DR13 Albareti et al. 2017), with observations obtained using the Loiano telescope at the Bologna Observatory. The imaging observations, carried out at the 2.1 m telescope at San Pedro Martir are described in Section 3, and their calibration are described in Section 4, while our nuclear spectroscopy is given in Section 5. The criterion to separate strong from weak Hα detections and from undetected targets is described in Section 6. The results are given and discussed in section 7. We adopt a flat Λ CDM cosmology with ΩM = 0.3, Ω Λ = 0.7 and Ho = 73 km s−1 Mpc−1. Magnitudes are given in the AB system.
2 The sample
The sample of ETGs analysed in this work is extracted from the ATLAS3D whole sky catalogue of 260 ETGs (see Fig. 1). The selection criteria adopted by Cappellari et al. (2011a) for including objects in ATLAS3D are: that they belong to a volume-limited sample of 42 Mpc radius, are brighter than Mk = −21.5 mag, and have −6∘ < δ < 64∘. On our side, the selection criterion for including them in our investigation is purely positional, according to target visibility in the spring from the site of SPM (Latitude = +31 deg). ETGs were selected in the range 10h < RA < 16h; 0∘ < Dec < 35∘, containing the Virgo cluster. Out of the 260 galaxies in the ATLAS3D survey, 151 fall within the above boundaries: of these, 29 were observed in previous Hα imaging campaigns, 4 were not observed because of the presence of bright stars in their vicinity, the remaining 118 are the subject of the present observational campaigns, as illustrated in Figure 1 (blue symbols)1. The selection of 147 out of 260 ATLAS3D targets does not bias the distribution of the selected galaxies, both as far as the morphological and the kinematical type. The morphological type mix in ATLAS3D is 74% S0 and 26% E; in our sample the two percentages become 68% and 32%. In ATLAS3D 14% of ETGs are slow rotators (SR) and the remaining 86% are fast rotators (FR); in our sample the two percentages become 17% and 83%. However, the observed sample contains the Virgo cluster and is more biased in favor of cluster galaxies (52%) with respect to the entire ATLAS3D survey (29%).
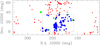 |
Fig. 1 Full ATLAS3D survey (red triangles) and subsample of 147 targets observed in Hα as partof this work (blue circles). Green squares represent the 20 filler targets (not in ATLAS3D). |
3 Imaging observations
Narrow band imaging of the Hα line emission (rest frame λ = 6562.8 Å) of 118 galaxies in the main program (+20 filler targets) was obtained using the 2.1 m telescope at the San Pedro Martir Observatory, belonging to the Mexican Observatorio Astronómico Nacional (OAN). The Hα measurements of the remaining 29 targets included in the present investigation are taken from the literature. The observationswere scheduled in two observing runs of 8 nights each in 2015 (March 17–24) and 2016 (April 7–14), both including new moon periods. Due to the presence of the Niño on the Pacific, both runs were severely affected by bad whether. In 2015, in particular, 4 nights were clear, and only 1.5 of them were photometric. In 2016 we worked in nearly photometric conditions during 5 nights out of 8. In both years the Marconi CCD type e2vm2 was used with 2048 × 2048 pixel, binned 2 times with a pixel scale of 0.35 arcsec, in a field of view of 5.5 × 5.5 arcmin. Each galaxy was observed using a narrow-band interference filter, whose bandpass includes the redshifted wavelength of the Hα line and also the[NII] lines (ON-band frame). These filters maximise the throughput at the galaxy redshift, (see Fig. 2)2 . For each galaxy, we acquired 3 ON-band exposures with an integration time ranging from 5 to 10 min, according to the seeing conditions and source brightness. The stellar continuum subtraction was secured by means of shorter (typically 3 × 1 min) exposures taken through a broad-band (λ ~ 6231 Å, Δλ ~ 1200 Å) r-Gunn filter (OFF-band frames).
While the median seeing of the San Pedro Martir site is ~0′′.6, the final FWHM for point sources in the images is affected by the poor telescope guiding and dome seeing. The final distribution ranges from ~1′′ to ~2′′, with a mean seeing of 1″.20 ± 0″.02 in 2015 and 1″.50 ± 0″.02 in 2016, as shown in Figure 33.
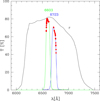 |
Fig. 2 Transmission profiles of the narrow band filters (6603 Å green line; 6723 Å blue line) and of the r-band filter (black line). The observed galaxies (red dots) are plotted on top of the narrow filter profiles at the wavelength given by their redshift. |
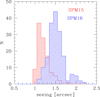 |
Fig. 3 Seeing conditions in 2015 (red) and 2016 (blue) measured onthe final images. On average the seeing in 2015 was 1.2 arcsec, while in 2016 was 1.5 arcsec. |
4 Data reduction
We reduce the CCD frames following the procedure described in Gavazzi et al. (2012), based on the STSDAS and GALPHOT IRAF packages. We refer the reader to that paper for details and give here only a brief summary of the data reduction procedures. The methods to extract the photometry of the Hα+[NII] line (flux and equivalent width) and to estimate its error budget can also be found in Sect. 4.2 of Gavazzi et al. (2012).
In short, each image is bias-subtracted and flat-field corrected using sky exposures obtained during twilight in sky regions devoid of stars. When three exposures on the same object are available, we adopt a median combination of the realigned images to help rejecting the cosmic rays hits in the final stack. Otherwise we remove cosmic rays by direct inspection of the frames. We subtract a mean sky background, computed around the galaxy, using the GALPHOT tasks MARKSKYand SKYFIT. The flat-fielded ON-frames were aligned withthe OFF-frames using field stars. At this stage the seeing was determined independently on the two sets of images. After normalisation of the OFF-band frames (see Sect. 4.1), NET images were produced by subtracting the OFF from the ON-frames.
Given the high Galactic latitude of the observed sample, no flux correction for Galactic extinction was applied. Also we did not attempt deblending of Hα from [NII] lines and no correction for internal extinction was applied.The corrections computed with the scaling relations given in Sect. 4.2 of Gavazzi et al. (2012) refer to spiral galaxies, thus they do not necessarily apply to our sample of ETGs. In the following, when we refer to Hα measurements, we mean Hα+[NII], uncorrected for internal dust extinction.
4.1 Calibrations
We calibrate the absolute flux scale using the standard stars Feige34, HZ44 and BD33 from the catalogue of Massey et al. (1988), observed every ~2 hours. As seen in Figure 4, where the log of ZP (in erg cm−2 sec−1) is displayed, only night 7 and the first part of night 8 in 2015 can be considered photometric. For this reason, except for these two periods, most targets observed in 2015 were re-observed in 2016. Conversely the 2016 run was clear in all 5 observable nights, with an acceptable uncertainty of 5% on the zero point.
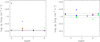 |
Fig. 4 Log of the photometric ZP (in erg cm−2 sec−1) in 2015 (left) and 2016 (right), separately for the stars BD33 (blue), HZ44 (green) and FG34 (red). The dashed lines show the 1σ error bars computed using only the photometric periods in 2015 (night 7 and part of night 8) and all measurements taken in 2016. |
4.2 Second order calibration
Due to the photometric instability in 2015 and owing to the full sky coverage of the SDSS survey (York et al. 2000) we check and correct the calibration of our r band images by comparing the photometry of stars in each field with their SDSS magnitudes. Using the SDSS navigator tool, we inspected each target field and identified at least 10 stars, 5 bluer and 5 redder than approximately g − r = 0.8 mag. For these stars we compared the SDSS r mag with the one measured in our r frames assuming the ZP derived for that night from the calibration stars. For each field we compute separately the median g − r of the 5 blue and 5 red stars so that, for each field, only two median measurements are considered. The median difference between the two sets of magnitudes (KR) is plotted in Figure 5 as a function of the star colour (g − r). While most measurements taken in 2016 appear accurate, we confirm the presence of few non photometric measurements taken in 2015. We fit the 2016 data and we use the ratio of the individual data taken in 2015 to the 2016 fit to find out the correct KR coefficient. A similar method was used to check and correct the calibration of the ON-band data taken through the narrow band filters.
In ideal conditions the flux ratio of field stars should reflect the ratio in filter width combined with the ratio of integration time. In our case the width ratio between our r band filter and the narrow band ones is approximately 11.5 (we compensate this large difference by adopting approximately 5 times longer integration time for the ON-band observation). As remarked by Spector et al. (2012), however the normalisation factor (KHα) depends on the color of the stars, and the KHα coefficient to be adopted should correspond to the actual color of the target galaxy (in our case for ETGs g − r ~ 0.8), as illustrated in Fig. 5. By applying this method we were able to improve the calibration for both the r band and the Hα filters for the 118 observed galaxies.
A check of the quality of our flux calibration is performed in Figure 6 where we compare the Hα+[NII] flux measured in this work with the value reported in the literature by Trinchieri & di Serego Alighieri (1991) and by Macchetto et al. (1996), for 13 galaxies in common (mostly upper limits). Nine of them are in good agreement, while two show discrepancies by one order of magnitude.
As a final test we plot in Figure 7 a comparison between the flux (left panel) and equivalent width (EW) (right panel) derived in our imaging data (separately for strong (blue) and weak (green) detections (see Sect. 1), including the 20 filler targets) by integrating the signal in a circular region of 3 arcsec diameter, with the values measured in the available nuclear spectra (Hα+[NII]), showing a satisfactory agreement. The nuclear spectra were taken from SDSS (DR13) when available, or from NED (for the most part taken from Ho et al. 1995). The remaining 36 targets were observed by us using the Loiano 1.5 m telescope, as described next. These are plotted only in the right panel of Figure 7, as they were not flux calibrated.
Due to the intrinsic shape of ETGs, namely their featureless Hα emission, it is often difficult to assess the robustness of the Hα emission associated with them, based on the inspection of the NET images. NET frames result from the subtraction of ON-OFF images, both containing bright, cuspy structures. Small variations in the seeing conditions combined with slightly (few percent) imprecise determinations of the normalisation coefficient can affect the resulting NET image. Buson et al. (1993) and Macchetto et al. (1996) adopted a strategy for adjusting the normalisation coefficient that was based on the absence of negative NET residuals in the external parts of the galaxies themselves. Buson et al. (1993) in particular observed a sample of ETGs previously known for having some Hα emission. Thus they adjusted the continuum subtraction up to the point that some Hα residual remained in the NET image, without producing negative residuals in the outer parts. More quantitative, but based on a similar strategy, was the criterion adopted by Michielsen et al. (2004). These authors measured the ON-band and OFF-band flux in a elliptical corona fit to the galaxy periphery (between two fixed surface brightness levels), and set the normalisation coefficient so that the two values were identical. Both these criteria assume that no Hα emission is present in the external regions of ETGs. We preferred not to adopt such an priori criterion, but to use many field stars to set the normalization coefficient, as described above.
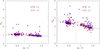 |
Fig. 5 Left panel: flux ratio KR in r band between SDSS and this work plotted as a function of g − r color of stars in the field. The 2016 data are plotted in red, while the 2015 data in blue, including some non-photometric measurements. These can be corrected using the 2016 fit by adjusting their KR coefficient to the value derived from the 2016 fit computed at g − r = 0.8 using the vertical dashed line drawn at g − r = 0.8 which intersects the best fit relation of the 2016 data. Right panel: same for the KHα coefficient. |
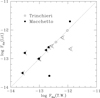 |
Fig. 6 Comparison of the Hα+[NII] flux measured in this work with the one measured by Macchetto et al. (1996) and by Trinchieri & di Serego Alighieri (1991) for 13 galaxies in common. Only 4 objects were detected by us, the remaining are upper limits. |
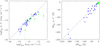 |
Fig. 7 Comparison between the Hα+[NII] flux (left) and EW (right) detected in the central 3 arcsec in the imaging data and in the nuclear spectra, the right panel includes the 36 spectra taken at Loiano. Blue are strong detections, green are weak detections (the most discrepant object is N4526). The sources of observations of nuclear spectra are provided in Table A.5. The 45 degree lines serve to guide the eye to the proportionality relations. |
5 Spectroscopic observations
Spectroscopic observations of 36 targets were found neither in the SDSS spectroscopic catalogue nor in FITS form within the NED database. These nuclear spectra were obtained by us during several observing runs between 2013 and 2017 using the Bologna Faint Object Spectrograph and Camera (BFOSC; Gualandi & Merighi 2001) mounted on the 152 cm F/8 Cassini Telescope located in Loiano, belonging to the Observatory of Bologna. Similarly to previous observations at Loiano (Gavazzi et al. 2011, 2013), we acquired long-slit spectra taken through a slit of 2 arcsec width and 12.6 arcmin length, combined with an intermediate-resolution red-channel grism (R ~ 2200) covering the 6100–8200 Å portion of the spectrum which includes the Hα, [NII], and [SII] lines. BFOSC is equipped with a EEV LN/1300-EB/1 CCD detector of 1300 × 1340 pixels, reaching 90% QE near 5500 Å. For the spatial scale of 0.58 arcsec/pixel, and a dispersion of 8.8 nm/mm, the resulting spectra have a resolution of 1.6 Å/pix.
Exposures of 5–10 min were repeated typically three times (to remove cosmic ray hits). The slit was generally set in the E-W direction, except when taken along the direction connecting two nearby objects which simultaneously fell in the slit. The wavelength calibration was secured by means of frequent exposures of a He-Ar hollow-cathode lamp and further refined using bright OH sky lines. The spectrograph response was obtained by daily exposures of the star Feige34.The typical seeing conditions at Loiano ranged from 1.5′′ to 2.5′′. The spectra taken at Loiano were not flux calibrated, and only measurements of the lines EW were derived (right panel of Fig. 7).
The spectra were reduced using standard IRAF procedures. After normalisation to the flux in the interval 6400–6500 they have been shifted to λ0 according to their redshift. Plots of the nuclear spectra obtained at Loiano, covering approximately from 6200–7200 Å, are given in Fig. A.1.
6 Results
The detection threshold that we adopt in this paper comes from a combinationof a flux and morphology criterion in the NET images: we consider detections all sources that have the global Hα+[NII] EW ≤−1 Å (negative means emission), combined with Hα+[NII] EW3 ≤−1 Å, as determined in the central 3 arcsec aperture. To these sources we add those (only 3 objects: M 86 filamentary, NGC 3156 and NGC 4435 disky) that, while not meeting the Hα EW thresholds, show clear disk-like or filamentary structures in their NET images.
Adopting these criteria we detect 55 out of 147 galaxies, with a global detection rate of 39%, we find 21 strong detections with Hα+[NII] EW ≤ –5 , 34 weak detections with − 1 ≤ EW < –5 , and 92 undetected targets with Hα+[NII] EW > −1.
Hα continuum subtraction for weak Hα emitters is subject to large errors. Colors may vary within galaxies (Spector et al. 2012). Thus continuum subtraction errors may be relevant, especially for galaxies dominated by central emission (e.g. AGNs). We notice that, out of 34 weak candidate detections, few (NGC 2778, NGC 4377 and NGC 4551) could be spurious, as these galaxies show marginal global Hα EW, have featureless Hα morphology, and they do not contain gas. Conversely, some undetected galaxies (NGC 3379, NGC 4281 and NGC 5813) could be missed detections (on the basis of their gas content and/or disk morphology in the HST images). Even among the 21 strong detections, two: NGC 4429 and NGC 4550 might be partly contaminated by imperfect continuum subtraction (see Fig. A.1). Nevertheless, three missing and five spurious detections would not change the conclusions of the present investigation. Notice also that a large fraction (50%) of the weak sources are AGNs (or LIN). This means that their nuclear spectrum is dominated by [NII] rather than by Hα, thus not contributing to their nuclear SFR (e.g. Theios et al. 2016). For these objects the SFRs given in Table A.5 must be considered as upper limits.
The NET and OFF images of the 14 galaxies with strong Hα emission observed in this work are given in grey-scale in Fig. A.2. Note that the ON- and normalized OFF-images were not convolved to the same resolution before subtraction to produce NET images free from seeing effects. This is made possible by our strategy of observing the ON and OFF frames not only in the same night, but also within minutes one from the other.
Table 1 reports separately for the strong and weak Hα detections and for the undetected targets the fraction of objects for each optical morphological class, the fraction of conspicuous Hα disks and/or dusty structures in the HST images, the fraction of gas-rich (HI or CO detected) objects and the fraction of AGN, passive and HII region-like nuclei from spectroscopy. Strong detections appear associated mainly to S0, gas-rich galaxies, with Hα and HST disks and for the most part harbouring HII region-like nuclei. AGNs are overabundant among weak sources. This implies that the emission in this class of sources is not due to star formation associated to the Hα line, but to relatively strong [NII]. Moreover undetected targets are gas-free, disk-free systems without star formation neither extended nor nuclear, without abundant AGNs, but with passive nuclear spectra.
The strong Hα emitters (Hα EW ≤ −5) are significantly (11/21: 52%) associated to HII region-like spectra. On the opposite, the weak Hα emitters ( − 1 ≤ EW < –5) are 19/34: 55% AGN and 15/34: 44% PAS or RET, with none HII.
As far as the environmental dependence of the ETGs properties, we recall that Cappellari (2016) finds that slow rotators have a significant fraction only in the center of cluster and groups. Our subsample of ATLAS3D comprises the entire Virgo cluster, thus we can check if also the fraction of detected and undetected galaxies correlates with the projected distance from M 87. We find that 38% of the strong detected galaxies and 58% of the undetected galaxies are found inside the Virgo cluster hinting at a marginal environmental anticorrelation between the ionised gas content (and star formation) and the projected galaxy density.
To show that ATLAS3D targets are genuine red-sequence systems, with only little contamination from blue-cloud and green-valley objects, we plot in Figure 8 the color (g − r) versus stellar mass (M⊙) relation for the full ATLAS3D sample (large symbols), while in the same figure we plot (small symbols) the color–luminosity relation from a complete sample of SDSS galaxies in the Coma Supercluster (selected and morphologically classified by Gavazzi et al. 2010), separately for LTG (blue) and ETG (red).
In Figure 8 (left panel) we first confirm a result already known from Emsellem et al. (2011) who showed that slow rotators tend to be massive (Mdyn ~ 1010.5 M⊙) and dominate the high-mass end of ETGs. This result has been emphasised by Veale et al. (2017) who showed that the fraction of slow rotators, that is a mere 14% in the ATLAS3D survey, reaches 90% for the massive (Mdyn ~ 1010.5 M⊙) ETGs (MK < −26 mag). For example, the brightest ATLAS3D members of the Virgo cluster that are included in our work (N4472 = M 49, N4486 = M 87, N4374 = M 84 and N4406 = M 86) are all slow rotators (see also Boselli et al., 2014a). In agreement with Emsellem et al. (2011) we interpret this result as an indication that massive slow rotators represent the extreme instances within the red sequence of galaxies which might have suffered from significant merging without being able to rebuild a fast-rotating component.
Figure 8 (central panel) gives the color-mass relation dividing galaxies with respect to their nuclear spectral classification according to (2011, 2013)4. AGNs (SEY+AGN) are plotted separately from passive (PAS+LIN+RET) and from HII-like systems. Again there is a significant separation between the average luminosity of AGNs which are brighter than PAS by 0.6 mag on average. This result is not unexpected (see e.g. Gavazzi et al. 2011) and, along with the previous finding, it helps explaining why in ATLAS3D slow rotators contain a larger fraction of AGNs (31%) with respect to fast rotators (13%). Conversely, HII region-like nuclei are harboured by the least massive galaxies, but the small statistics prevents us from being more quantitative. The frequency ofAGNs is 30% among galaxies more massive than 1010.5 M⊙, i.e. significantly higher than 10% found among galaxies less massive than 1010.5 M⊙. These values are consistent with the ones of Kauffmann et al. (2003b) who found that galaxies with 1010.5 M⊙ harbour between 20 and 40% of AGNs. They also found that the fraction of AGNs among emission-line galaxies increases steeply with mass, reaching 100% when as the stellar mass reaches 1011.5 M⊙.
In order to understand the difference between ETGs that are detected in Hα from the undetected ones, we plot in Figure 8 (right panel) the color–mass relation for the subsample of 147 ATLAS3D observed in Hα, subdivided between detected (strong or weak) and undetected objects. Significant mass segregation is evident. Weak detections are spread over the entire mass range, and the most massive objects coincide with slow-rotating AGNs. The strong detections are associated with low-mass systems, which from the previousanalysis were identified with HII-region like nuclei. These are associated with S0 galaxies and tend to avoid Es.
In Figure 9 we compare the SFR derived for a set of galaxies in the HRS catalogue of Boselli et al., (2015) (mainly composed of LTGs) with the SFR obtained for ETGs in this work(limited to the 55 galaxies detected in our Hα imaging campaign). Its is clear that LTGs have, for any given stellar mass,about a factor of 20 higher SFR than ETGs, and that ETGs in our survey agree well with the few in the HRS survey.
By looking at the relation between the frequency of Hα detections and the gaseous content (HI or H2) (Fig. 10), we find an obvious correlation: among the 55 Hα detected ETGs, 33 (60%) are found to retain gas. On the other hand, only 7(8%) of the 92 undetected ETGs have gas. However, when considering the 12 detected objects that have positive HI and H2 detections (notice that 11 of them are S0 and only one is a E), we find a barely significant correlation between the total (HI + H2) gas mass and the Hα luminosity (see the red symbols in Fig. 10). If we over-plot the relation between the similar quantities for a sample of 131 LTGs from the Herschel Reference Sample by Boselli et al., (2010) that have been detected in Hα (Boselli et al., 2015) and in HI and CO (Boselli et al., 2014b) we find that the ETG population is consistent with the low-mass tail of LTGs. Notice that among the 12 detected ETGs with gas in Figure 10, 6 have HII region-like nuclear spectra, indicating that star formation is occurring in their nuclei. The other 6 are AGNs of some kind. Furthermore 8 are galaxies with relatively strong Hα luminosity and EW and gaseous content. The 4 lowest luminosity and gas content ones are members of the Virgo cluster (within 7 degrees of projected angular separation from M 87).
To assess the comparison of the ETGs with the LTGs from HRS in the Hα luminosity/dust mass plane, we cross correlate the HRS catalogue (Ciesla et al. 2014) with the ATLAS3D sample of 147 ETGs observed by us in Hα, finding 11 matches. In Figure 11 we plot (with similar symbols as in Fig. 10) the relation between Hα luminosity and dust mass for 214 LTGs detected at 22 micron by WISE and at 250 micron by SPIRE on board Herschel, providing an estimate of the dust mass. It is again evident that the 11 ETGs do not deviate significantly from the sequence occupied by LTGs.
The majority of ATLAS3D targets have been observed with HST, providing high resolution optical images. Many of them appear to harbor a distinct disk structure at their interior. Interestingly, 30/55 (55%) of the detected ETGs show evidence of structures (disk or dust filaments) in the HST images. Conversely only 4 (4%) of the 92 undetected ETGs have similar structures. 8/12 gas-rich ETGs show dusty disks in the HST images. The galaxy morphological mix in the observed sample is 68% S0 versus 32% Es. Among the detected ones this mix does not change at all: 68% S0 and 32% Es.
Dividing galaxies between Hα detected and undetected, these ratios become: among detected galaxies 32/55 (58%) are AGN of various type; 11/55 (20%) are HII regions; 12/55 (22%) are PAS. Among undetected galaxies 13/92 (14%) are AGN of various type; 0/92 (0%) are HII regions; 74/92 (80%) are PAS. Summarising, the relative majority of detected galaxies are AGNs, while the relative majority of undetected galaxies are PAS.
Fraction of ETG galaxies of various types.
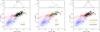 |
Fig. 8 Color-stellar mass relation for a complete sample of galaxies in the Coma and Local supercluster from Gavazzi et al. (2010) (small symbols), subdivided in ETGs (red) and LTGs (blue) to show the separation between the red and the blue sequence. Left: the 32 slow rotators (green open symbols) and the 222 fast rotators (black filled symbols) ETGs from the whole ATLAS3D (large symbols). Center: the 41 AGNs (green open symbols) and the 165 passive (black filled symbols) ETGs from the whole ATLAS3D (large symbols). Right: the 22 detected strong (red), 33 detected weak (green open symbols), and the 92 undetected (black filled symbols) ETGs from the observed ATLAS3D (large symbols). |
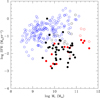 |
Fig. 9 Relation between the stellar mass and the SFR separately for a set HRS galaxies (empty symbols): (blue: LTG, black: S0 + S0a, red: E) and the ETGs from this work (filled symbols): red: E; black: S0. |
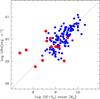 |
Fig. 10 Relation between the gas (HI + H2) mass and the Hα luminosity separately for a set of 131 LTGs from HRS (blue) and 12 ETGs from this work (red). The dotted line is to guide the eye on the direct proportionality relation. |
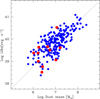 |
Fig. 11 Relation between the dust mass and the Hα luminosity separately for a set of 214 LTGs from HRS (blue) and 11 ETGs from this work (red). The dotted line is to guide the eye on the direct proportionality relation. |
Logbook of the observations.
7 Conclusions and summary
We have analysed Hα imaging observations of 147 early-type galaxies selected from the (260) targets in the ATLAS3D catalogue, assumed as representative of the ETG population in the local Universe. For the totality of our sample we also gathered nuclear spectroscopy, either from the literature, or by new observations (36 objects), allowing their nuclear classification. 55 ETGs (37%) were detected as Hα emitters above our threshold limit (Hα EW ≤ –1), and 21 of which above Hα EW ≤ –5 . 76% of the strong emitters were found associated with low-mass (M*~ 1010 M⊙) S0 galaxies, showing a conspicuous gas (HI + H2) content, extended stellar disks and showing star formation even in their nuclei. All but 2 of them are fast rotators. The remaining 33 weak detections were found associated with more massive (M*~ 1011 M⊙), gas-poor targets often harbouring an AGN in their nucleus. Two third of them are fast rotators and 64% are associated to S0 galaxies. The majority of the remaining (92) undetected systems are gas-poor and disk-less and show a passive spectrum even in their nucleus. 88% of them are associated with fast rotators and 66% with S0 galaxies.
These pieces of evidence, put in the ligth of the cinematic measurements provided by ATLAS3D (Cappellari 2016), reinforce the evolutionary picture where the majority of todays low-mass ETGs are in fact the outcome of secular evolution of disky-gas rich systems governed by rotation and star formation, both on the disk and on the nuclear scale. On the contrary the most massive (M* > 1010 M⊙) ETGs are genuine products of dry merging which dissipated their angular momentum and provide the evolutionary track of giant galaxies at the center of rich clusters of galaxies.
Acknowledgements
This research has made use of the GOLDmine database (Gavazzi et al. 2003) and of the NASA/IPAC Extragalactic Database (NED) which is operated by the Jet Propulsion Laboratory, California Institute of Technology, under contract with the National Aeronautics and Space Administration. Funding for the Sloan Digital Sky Survey (SDSS) and SDSS-II h as been pro-vided by the Alfred P. Sloan Foundation, the Participating Iinstitutions, the National Science Foundation, the U.S. Department of Energy, the National Aeronautics and Space Administration, the Japanese Monbukagakusho, and the Max Planck Society, and the Higher Education Funding Councill for England. The SDSS Web site is http://www.sdss.org/. The SDSS is managed by the Astrophysical Research Consortium (ARC) for the Participating Institutions.The Participating Institutions are the American Museum of Natural History, Astrophysical Institute Potsdam, University of Basel, University of Cambridge, Case Western Reserve University, The University of Chicago, Drexel University, Fermilab, the Institute for Advanced Study, the Japan Participation Group, The Johns Hopkins University, the Joint Institute for Nuclear Astrophysics, the Kavli Institute for Particle Astrophysics and Cosmology, the Korean Scientist Group, the Chinese Academy of Sciences (LAMOST), Los Alamos National Laboratory, the Max-Planck-Institute for Astronomy (MPIA), the Max-Planck-Institute for Astrophysics (MPA), New Mexico State University, Ohio State University, University of Pittsburgh, University of Portsmouth, Princeton University, the United States Naval Observatory, and the University of Washington. M. Fossati acknowledges the support of the Deutsche Forschungsgemeinschaft via Project ID 387/1-1. M. Fumagalli acknowledges support by the Science and Technology Facilities Council [grant number ST/P000541/1].
Appendix A
The logbook of the observations is provided in Table 2.
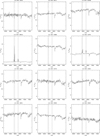 |
Fig. A.1 Spectra taken at Loiano with the red grism covering approximately from 6200 to 7200 Å. The spectra have been Doppler shifted to λ0 and normalized to the flux in the interval 6400–6500 . The vertical broken lines mark the rest-frame position of [NII]λ6549; Hαλ6563;[NII]λ6584; [SII]λ6717, [SII]λ6731. |
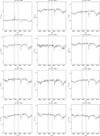 |
Fig. A.1 continued. |
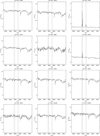 |
Fig. A.1 continued. |
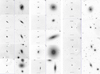 |
Fig. A.2 NET (left) and OFF (right) images of 14 galaxies with strong Hα detections (in the present observation campaign). North is up and east to the left. A 1 arcmin bar is given in all images. |
The 147 galaxies selected from ATLAS3D for Hα observations(either from this work or from the literature) are listed in Table A.1, organized as follows:
-
Column (1): Galaxy name;
-
Column (2) and (3): J2000 Celestial coordinates;
-
Column (4): Recessional velocity in km s−1 ;
-
Column (5): Assumed distance in Mpc;
-
Column (6): Morphological classification in ATLAS3D (Cappellari et al. 2011a);
-
Column (7): SDSS magnitude in g from Consolandi et al. (2016);
-
Column (8): SDSS magnitude in r from Consolandi et al. (2016);
-
Column (9): log of stellar mass M* computed by us from the r band absolute magnitude and the g − r color index using the prescription of Zibetti et al. (2009).
-
Column (10): Kinematic classification in ATLAS3D (Emsellem et al. 2011) as fast (F) or slow (S) rotators;
-
Column (11): Log of the molecular hydrogen mass (H2) in M⊙ with sign, as given by Young et al. (2011); when a CO spectrum is available from NED, but an estimate of the H2 mass is not given, a “H2” is reported.
-
Column (12): Log of the atomic hydrogen mass (HI) in M⊙ with sign, as given by Serra et al. (2012); when a HI spectrum is available from NED (mostly from ALFALFA), but an estimate of the HI mass is not given a “HI” is reported.
The observational parameters of the target galaxies are given in Table 5 as follows:
-
Column (1): Galaxy name;
-
Column (2): Reference to the Hα observation (see also Col. 16 in Table A.5);
-
Column (3): Air mass during the ON-band exposure in 2015;
-
Column (4): Air mass during the OFF-band exposure in 2015;
-
Column (5): Air mass during the ON-band exposure in 2016;
-
Column (6): Air mass during the OFF-band exposure in 2016;
-
Column (7): Exposure time (in seconds) of the individual ON-band exposure in 2015; 3 equal exposures were combined.
-
Column (8): Exposure time (in seconds) of the individual OFF-band exposure in 2015; 3 equal exposures were combined.
-
Column (9): Exposure time (in seconds) of the individual
ON-band exposure in 2016; 3 equal exposures were combined.
-
Column (10): Exposure time (in seconds) of the individual OFF-band exposure in 2016; 3 equal exposures were combined.
The results of our Hα imaging campaign are listed in Table 7, organised as follows:
-
Column (1): Galaxy name;
-
Column (2, 3): (EW) Hα+[NII] (in Å) measured in a circular aperture of 3′′ positioned on the galaxy nucleus, with associated uncertainty;
-
Column (4, 5): Log of the Hα+[NII] flux (erg cm−2 s−1) measured in a circular aperture of 3′′ positioned on the galaxy nucleus, with associated uncertainty;
-
Column (6, 7): Total (EW) Hα+[NII] (in Å) measured in a circular aperture containing the whole galaxy, with associated uncertainty;
-
Column (8, 9): Total log of the Hα+[NII] flux (erg cm−2 s−1) measured in a circular aperture containing the whole galaxy, with associated uncertainty;
-
Column (10): Log of the total star formation rate derived from the Hα flux as prescribed by Kennicutt (1998) but adapted for a Chabrier IMF.
-
Column (11): availability of a nuclear spectrum: LOI = taken at the Loiano 1.5 m telescope (this work); SDSS = taken from the SDSS database; NED = taken from NED; HO = in Ho et al. 1995; NEDMH = from NED taken at Mount Hopkins 1.5 m telescope.
-
Column (12): nuclear spectral classification; HII, SEY, AGN, PSB, RET, PAS, according to the criteria of (2012, 2013);
-
Column (13): 1 = strong Hα detection; 2 = weak detection, 3 = undetected.
-
Column (14): Hα morphological classification; d = disk, D = diffuse, c = centrally peaked, F = filamentary;
-
Column (15): HST imaging availability: -: not available; 0: available, featureless; 1: available, showing a prominent structure (disk or dust ring or filaments);
-
Column (16): Reference to Hα imaging.1: This work; 2: Koopmann & Kenney (2006); 3: Boselli et al. (2015); 4: Young et al. (1996); 5: Macchetto et al. (1996); 6: Koopmann et al. (2001); 7: Boselli & Gavazzi (2002); 8: Kennicutt & Kent (1983); 9: Trinchieri & di Serego Alighieri (1991); 10: Gavazzi et al. (2000), 11: Kenney et al. (2008).
Filler targets are listed in Table A.2, their observational parameters are given in Table 4 and the photometric parameters in Table A.6.
References
- Abazajian, K. N., Adelman-McCarthy, J. K., Agüeros, M. A., et al. 2009, ApJS, 182, 543 [NASA ADS] [CrossRef] [Google Scholar]
- Alam, S., Albareti, F. D., Allende Prieto, C., et al. 2015, ApJS, 219, 12 [NASA ADS] [CrossRef] [Google Scholar]
- Albareti, F. D., Allende Prieto, C., Almeida, A., et al. 2017, ApJS, 233, 25 [NASA ADS] [CrossRef] [Google Scholar]
- Baldry, I. K., Glazebrook, K., Brinkmann, J., et al. 2004, ApJ, 600, 681 [NASA ADS] [CrossRef] [Google Scholar]
- Balogh, M. L., Baldry, I. K., Nichol, R., et al. 2004, ApJ, 615, L101 [NASA ADS] [CrossRef] [Google Scholar]
- Belfiore, F., Maiolino, R., Maraston, C., et al. 2016, MNRAS, 461, 3111 [Google Scholar]
- Bell, E. F., McIntosh, D. H., Katz, N., & Weinberg, M. D. 2003, ApJS, 149, 289 [NASA ADS] [CrossRef] [Google Scholar]
- Bois, M., Emsellem, E., Bournaud, F., et al. 2011, MNRAS, 416, 1654 [NASA ADS] [CrossRef] [Google Scholar]
- Boselli, A., & Gavazzi, G. 2002, A&A, 386, 124 [NASA ADS] [CrossRef] [EDP Sciences] [Google Scholar]
- Boselli, A., & Gavazzi, G. 2006, PASP, 118, 517 [NASA ADS] [CrossRef] [Google Scholar]
- Boselli, A., & Gavazzi, G. 2014, A&ARv, 22, 74 [NASA ADS] [CrossRef] [Google Scholar]
- Boselli, A., Eales, S., Cortese, L., et al. 2010, PASP, 122, 261 [NASA ADS] [CrossRef] [Google Scholar]
- Boselli, A., Hughes, T. M., Cortese, L., Gavazzi, G., & Buat, V. 2013, A&A, 550, A114 [NASA ADS] [CrossRef] [EDP Sciences] [Google Scholar]
- Boselli, A., Voyer, E., Boissier, S., et al. 2014, A&A, 570, A69 [NASA ADS] [CrossRef] [EDP Sciences] [Google Scholar]
- Boselli, A., Cortese, L., & Boquien, M. 2014, A&A, 564, A65 [NASA ADS] [CrossRef] [EDP Sciences] [Google Scholar]
- Boselli, A., Fossati, M., Gavazzi, G., et al. 2015, A&A, 579, A102 [NASA ADS] [CrossRef] [EDP Sciences] [Google Scholar]
- Bryant, J. J., Owers, M. S., Robotham, A. S. G., et al. 2015, MNRAS, 447, 2857 [NASA ADS] [CrossRef] [Google Scholar]
- Buson, L. M., Sadler, E. M., Zeilinger, W. W., et al. 1993, A&A, 280, 409 [NASA ADS] [Google Scholar]
- Cappellari, M. 2016, ARA&A, 54, 597 [NASA ADS] [CrossRef] [Google Scholar]
- Cappellari, M., Emsellem, E., Krajnović, D., et al. 2011, MNRAS, 413, 813 [NASA ADS] [CrossRef] [Google Scholar]
- Cappellari, M., Emsellem, E., Krajnović, D., et al. 2011, MNRAS, 416, 1680 [NASA ADS] [CrossRef] [Google Scholar]
- Ciesla, L., Boquien, M., Boselli, A., et al. 2014, A&A, 565, A128 [Google Scholar]
- Consolandi, G., Gavazzi, G., Fumagalli, M., Dotti, M., & Fossati, M. 2016, A&A, 591, A38 [NASA ADS] [CrossRef] [EDP Sciences] [Google Scholar]
- di Serego Alighieri, S., Gavazzi, G., Giovanardi, C., et al. 2007, A&A, 474, 851 [NASA ADS] [CrossRef] [EDP Sciences] [Google Scholar]
- Emsellem, E., Cappellari, M., Krajnović, D., et al. 2011, MNRAS, 414, 888 [NASA ADS] [CrossRef] [Google Scholar]
- Gavazzi, G., Boselli, A., Vílchez, J. M., Iglesias-Paramo, J., & Bonfanti, C. 2000, A&A, 361, 1 [NASA ADS] [Google Scholar]
- Gavazzi, G., Boselli, A., Pedotti, P., Gallazzi, A., & Carrasco, L. 2002, A&A, 386, 114 [NASA ADS] [CrossRef] [EDP Sciences] [Google Scholar]
- Gavazzi, G., Boselli, A., Donati, A., Franzetti, P., & Scodeggio, M. 2003, A&A, 400, 451 [NASA ADS] [CrossRef] [EDP Sciences] [Google Scholar]
- Gavazzi, G., Fumagalli, M., Cucciati, O., & Boselli, A. 2010, A&A, 517, A73 [NASA ADS] [CrossRef] [EDP Sciences] [Google Scholar]
- Gavazzi, G., Savorgnan, G., & Fumagalli, M. 2011, A&A, 534, A31 [NASA ADS] [CrossRef] [EDP Sciences] [Google Scholar]
- Gavazzi, G., Fumagalli, M., Galardo, V., et al. 2012, A&A, 545, A16 [NASA ADS] [CrossRef] [EDP Sciences] [Google Scholar]
- Gavazzi, G., Consolandi, G., Dotti, M., et al. 2013, A&A, 558, A68 [NASA ADS] [CrossRef] [EDP Sciences] [Google Scholar]
- Gavazzi, G., Consolandi, G., Dotti, M., et al. 2015, A&A, 580, A116 [NASA ADS] [CrossRef] [EDP Sciences] [Google Scholar]
- Grossi, M., di Serego Alighieri, S., Giovanardi, C., et al. 2009, A&A, 498, 407 [NASA ADS] [CrossRef] [EDP Sciences] [Google Scholar]
- Gualandi R., & Merighi, R. 2001, Tech. Rep., Bologna Astronomical Observatory [Google Scholar]
- Ho, L. C., Filippenko, A. V., & Sargent, W. L. 1995, ApJS, 98, 477 [NASA ADS] [CrossRef] [Google Scholar]
- Kauffmann, G., White, S. D. M., & Guiderdoni, B. 1993, MNRAS, 264, 201 [NASA ADS] [CrossRef] [Google Scholar]
- Kauffmann, G., Heckman, T. M., White, S. D. M., et al. 2003a, MNRAS, 341, 54 [NASA ADS] [CrossRef] [Google Scholar]
- Kauffmann, G., Heckman, T. M., Tremonti, C., et al. 2003b, MNRAS, 346, 1055 [Google Scholar]
- Kenney, J. D. P., Tal, T., Crowl, H. H., Feldmeier, J., & Jacoby, G. H. 2008, ApJ, 687, L69 [NASA ADS] [CrossRef] [Google Scholar]
- Kennicutt, R. C., Jr. 1992, ApJ, 388, 310 [NASA ADS] [CrossRef] [Google Scholar]
- Kennicutt, R. C., Jr. 1998, ARA&A, 36, 189 [Google Scholar]
- Kennicutt, R. C., Jr. & Kent, S. M. 1983, AJ, 88, 1094 [NASA ADS] [CrossRef] [Google Scholar]
- Koopmann, R. A., & Kenney, J. D. P. 2006, ApJS, 162, 97 [NASA ADS] [CrossRef] [Google Scholar]
- Koopmann, R. A., Kenney, J. D. P., & Young, J. 2001, ApJS, 135, 125 [NASA ADS] [CrossRef] [Google Scholar]
- Koopmann, R. A., Haynes, M. P., & Catinella, B. 2006, AJ, 131, 716 [NASA ADS] [CrossRef] [Google Scholar]
- Macchetto, F., Pastoriza, M., Caon, N., et al. 1996, A&AS, 120, 463 [NASA ADS] [CrossRef] [EDP Sciences] [Google Scholar]
- Massey, P., Strobel, K., Barnes, J. V., & Anderson, E. 1988, ApJ, 328, 315 [NASA ADS] [CrossRef] [Google Scholar]
- Michielsen, D., de Rijcke, S., Zeilinger, W. W., et al. 2004, MNRAS, 353, 1293 [NASA ADS] [CrossRef] [Google Scholar]
- Moore, B., Lake, G., Quinn, T., & Stadel, J. 1999, MNRAS, 304, 465 [NASA ADS] [CrossRef] [Google Scholar]
- Paturel, G., Petit, C., Prugniel, P., et al. 2003, A&A, 412, 45 [NASA ADS] [CrossRef] [EDP Sciences] [Google Scholar]
- Penoyre, Z., Moster, B. P., Sijacki, D., & Genel, S. 2017, MNRAS, 468, 3883 [NASA ADS] [CrossRef] [Google Scholar]
- Sánchez, S. F., Kennicutt, R. C., Gil de Paz, A., et al. 2012, A&A, 538, A8 [NASA ADS] [CrossRef] [EDP Sciences] [Google Scholar]
- Serra, P., Oosterloo, T., Morganti, R., et al. 2012, MNRAS, 422, 1835 [NASA ADS] [CrossRef] [Google Scholar]
- Spector, O., Finkelman, I., & Brosch, N. 2012, MNRAS, 419, 2156 [NASA ADS] [CrossRef] [Google Scholar]
- Theios, R. L., Malkan, M. A., & Ross, N. R. 2016, ApJ, 822, 45 [NASA ADS] [CrossRef] [Google Scholar]
- Trinchieri, G., & di Serego Alighieri, S. 1991, AJ, 101, 1647 [NASA ADS] [CrossRef] [Google Scholar]
- Veale, M., Ma, C.-P., Thomas, J., et al. 2017, MNRAS, 464, 356 [NASA ADS] [CrossRef] [Google Scholar]
- Yıldız, M. K., Serra, P., Peletier, R. F., Oosterloo, T. A., & Duc, P.-A. 2017, MNRAS, 464, 329 [NASA ADS] [CrossRef] [Google Scholar]
- York, D. G., Adelman, J., Anderson, J. E., Jr., et al. 2000, AJ, 120, 1579 [CrossRef] [Google Scholar]
- Young, J. S., Allen, L., Kenney, J. D. P., Lesser, A., & Rownd, B. 1996, AJ, 112, 1903 [NASA ADS] [CrossRef] [Google Scholar]
- Young, L. M., Bureau, M., Davis, T. A., et al. 2011, MNRAS, 414, 940 [NASA ADS] [CrossRef] [Google Scholar]
- Zibetti, S., Charlot, S., & Rix, H.-W. 2009, MNRAS, 400, 1181 [NASA ADS] [CrossRef] [Google Scholar]
To fill-in the morning hours, in 2016 we selected 20 filler targets in the Coma and Hercules Superclusters (green symbols). They contribute mainly to the set up of the Hα reduction procedure (see Sect. 4.1).
The transmission profiles of the interferometric filters plotted in Figure 2 refer to the their nominal values, as measured in year 2000 at 20 degree Celsius. The transmission is however known to drift toward the blue by approximately 1 per 3 degree Celsius. The filter transmission is also known to change slightly with time and to migrate toward the blue with beam convergence. These last two effects were not taken into account when we computed the transmissivity at the galaxy redshift. They should however be negligible given the F8.5 focal ratio of the 2.1 m telescope.
The sky subtracted Hα NET and OFF-band (normalised r) images are made available via the http://goldmine.mib.infn.it/site. The ON-band image can be obtained by adding the NET to the OFF image. The adopted photometric zero point of the Hα images and the seeing are stored in the headers.
Gavazzi et al. (2011) classified the nuclear spectra dividing them in HII region like, strong AGNs (including SEY), liners (LIN), “retired” nuclei (RET) likely excited by old stars and passive nuclei (PAS).
All Tables
All Figures
|
Fig. 1 Full ATLAS3D survey (red triangles) and subsample of 147 targets observed in Hα as partof this work (blue circles). Green squares represent the 20 filler targets (not in ATLAS3D). |
| In the text | |
|
Fig. 2 Transmission profiles of the narrow band filters (6603 Å green line; 6723 Å blue line) and of the r-band filter (black line). The observed galaxies (red dots) are plotted on top of the narrow filter profiles at the wavelength given by their redshift. |
| In the text | |
|
Fig. 3 Seeing conditions in 2015 (red) and 2016 (blue) measured onthe final images. On average the seeing in 2015 was 1.2 arcsec, while in 2016 was 1.5 arcsec. |
| In the text | |
|
Fig. 4 Log of the photometric ZP (in erg cm−2 sec−1) in 2015 (left) and 2016 (right), separately for the stars BD33 (blue), HZ44 (green) and FG34 (red). The dashed lines show the 1σ error bars computed using only the photometric periods in 2015 (night 7 and part of night 8) and all measurements taken in 2016. |
| In the text | |
|
Fig. 5 Left panel: flux ratio KR in r band between SDSS and this work plotted as a function of g − r color of stars in the field. The 2016 data are plotted in red, while the 2015 data in blue, including some non-photometric measurements. These can be corrected using the 2016 fit by adjusting their KR coefficient to the value derived from the 2016 fit computed at g − r = 0.8 using the vertical dashed line drawn at g − r = 0.8 which intersects the best fit relation of the 2016 data. Right panel: same for the KHα coefficient. |
| In the text | |
|
Fig. 6 Comparison of the Hα+[NII] flux measured in this work with the one measured by Macchetto et al. (1996) and by Trinchieri & di Serego Alighieri (1991) for 13 galaxies in common. Only 4 objects were detected by us, the remaining are upper limits. |
| In the text | |
|
Fig. 7 Comparison between the Hα+[NII] flux (left) and EW (right) detected in the central 3 arcsec in the imaging data and in the nuclear spectra, the right panel includes the 36 spectra taken at Loiano. Blue are strong detections, green are weak detections (the most discrepant object is N4526). The sources of observations of nuclear spectra are provided in Table A.5. The 45 degree lines serve to guide the eye to the proportionality relations. |
| In the text | |
|
Fig. 8 Color-stellar mass relation for a complete sample of galaxies in the Coma and Local supercluster from Gavazzi et al. (2010) (small symbols), subdivided in ETGs (red) and LTGs (blue) to show the separation between the red and the blue sequence. Left: the 32 slow rotators (green open symbols) and the 222 fast rotators (black filled symbols) ETGs from the whole ATLAS3D (large symbols). Center: the 41 AGNs (green open symbols) and the 165 passive (black filled symbols) ETGs from the whole ATLAS3D (large symbols). Right: the 22 detected strong (red), 33 detected weak (green open symbols), and the 92 undetected (black filled symbols) ETGs from the observed ATLAS3D (large symbols). |
| In the text | |
|
Fig. 9 Relation between the stellar mass and the SFR separately for a set HRS galaxies (empty symbols): (blue: LTG, black: S0 + S0a, red: E) and the ETGs from this work (filled symbols): red: E; black: S0. |
| In the text | |
|
Fig. 10 Relation between the gas (HI + H2) mass and the Hα luminosity separately for a set of 131 LTGs from HRS (blue) and 12 ETGs from this work (red). The dotted line is to guide the eye on the direct proportionality relation. |
| In the text | |
|
Fig. 11 Relation between the dust mass and the Hα luminosity separately for a set of 214 LTGs from HRS (blue) and 11 ETGs from this work (red). The dotted line is to guide the eye on the direct proportionality relation. |
| In the text | |
|
Fig. A.1 Spectra taken at Loiano with the red grism covering approximately from 6200 to 7200 Å. The spectra have been Doppler shifted to λ0 and normalized to the flux in the interval 6400–6500 . The vertical broken lines mark the rest-frame position of [NII]λ6549; Hαλ6563;[NII]λ6584; [SII]λ6717, [SII]λ6731. |
| In the text | |
|
Fig. A.1 continued. |
| In the text | |
|
Fig. A.1 continued. |
| In the text | |
|
Fig. A.2 NET (left) and OFF (right) images of 14 galaxies with strong Hα detections (in the present observation campaign). North is up and east to the left. A 1 arcmin bar is given in all images. |
| In the text | |
Current usage metrics show cumulative count of Article Views (full-text article views including HTML views, PDF and ePub downloads, according to the available data) and Abstracts Views on Vision4Press platform.
Data correspond to usage on the plateform after 2015. The current usage metrics is available 48-96 hours after online publication and is updated daily on week days.
Initial download of the metrics may take a while.