Fig. 8
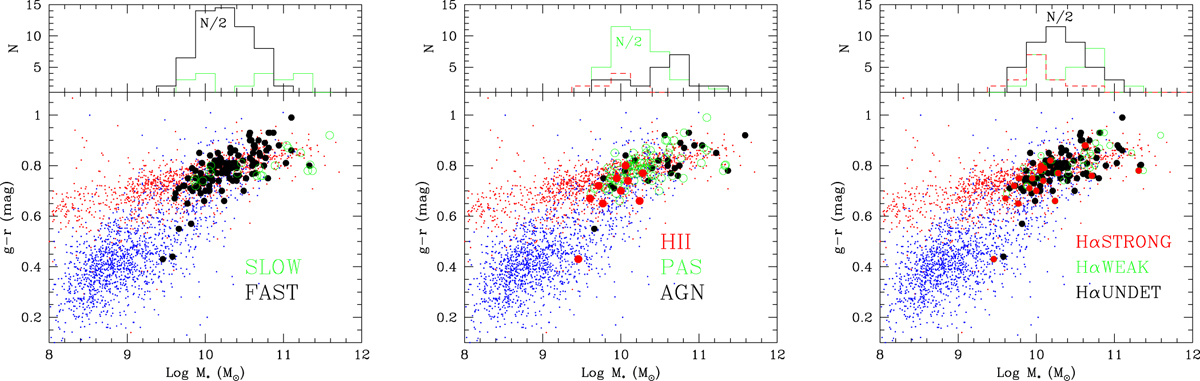
Color-stellar mass relation for a complete sample of galaxies in the Coma and Local supercluster from Gavazzi et al. (2010) (small symbols), subdivided in ETGs (red) and LTGs (blue) to show the separation between the red and the blue sequence. Left: the 32 slow rotators (green open symbols) and the 222 fast rotators (black filled symbols) ETGs from the whole ATLAS3D (large symbols). Center: the 41 AGNs (green open symbols) and the 165 passive (black filled symbols) ETGs from the whole ATLAS3D (large symbols). Right: the 22 detected strong (red), 33 detected weak (green open symbols), and the 92 undetected (black filled symbols) ETGs from the observed ATLAS3D (large symbols).
Current usage metrics show cumulative count of Article Views (full-text article views including HTML views, PDF and ePub downloads, according to the available data) and Abstracts Views on Vision4Press platform.
Data correspond to usage on the plateform after 2015. The current usage metrics is available 48-96 hours after online publication and is updated daily on week days.
Initial download of the metrics may take a while.