Free Access
Fig. 3
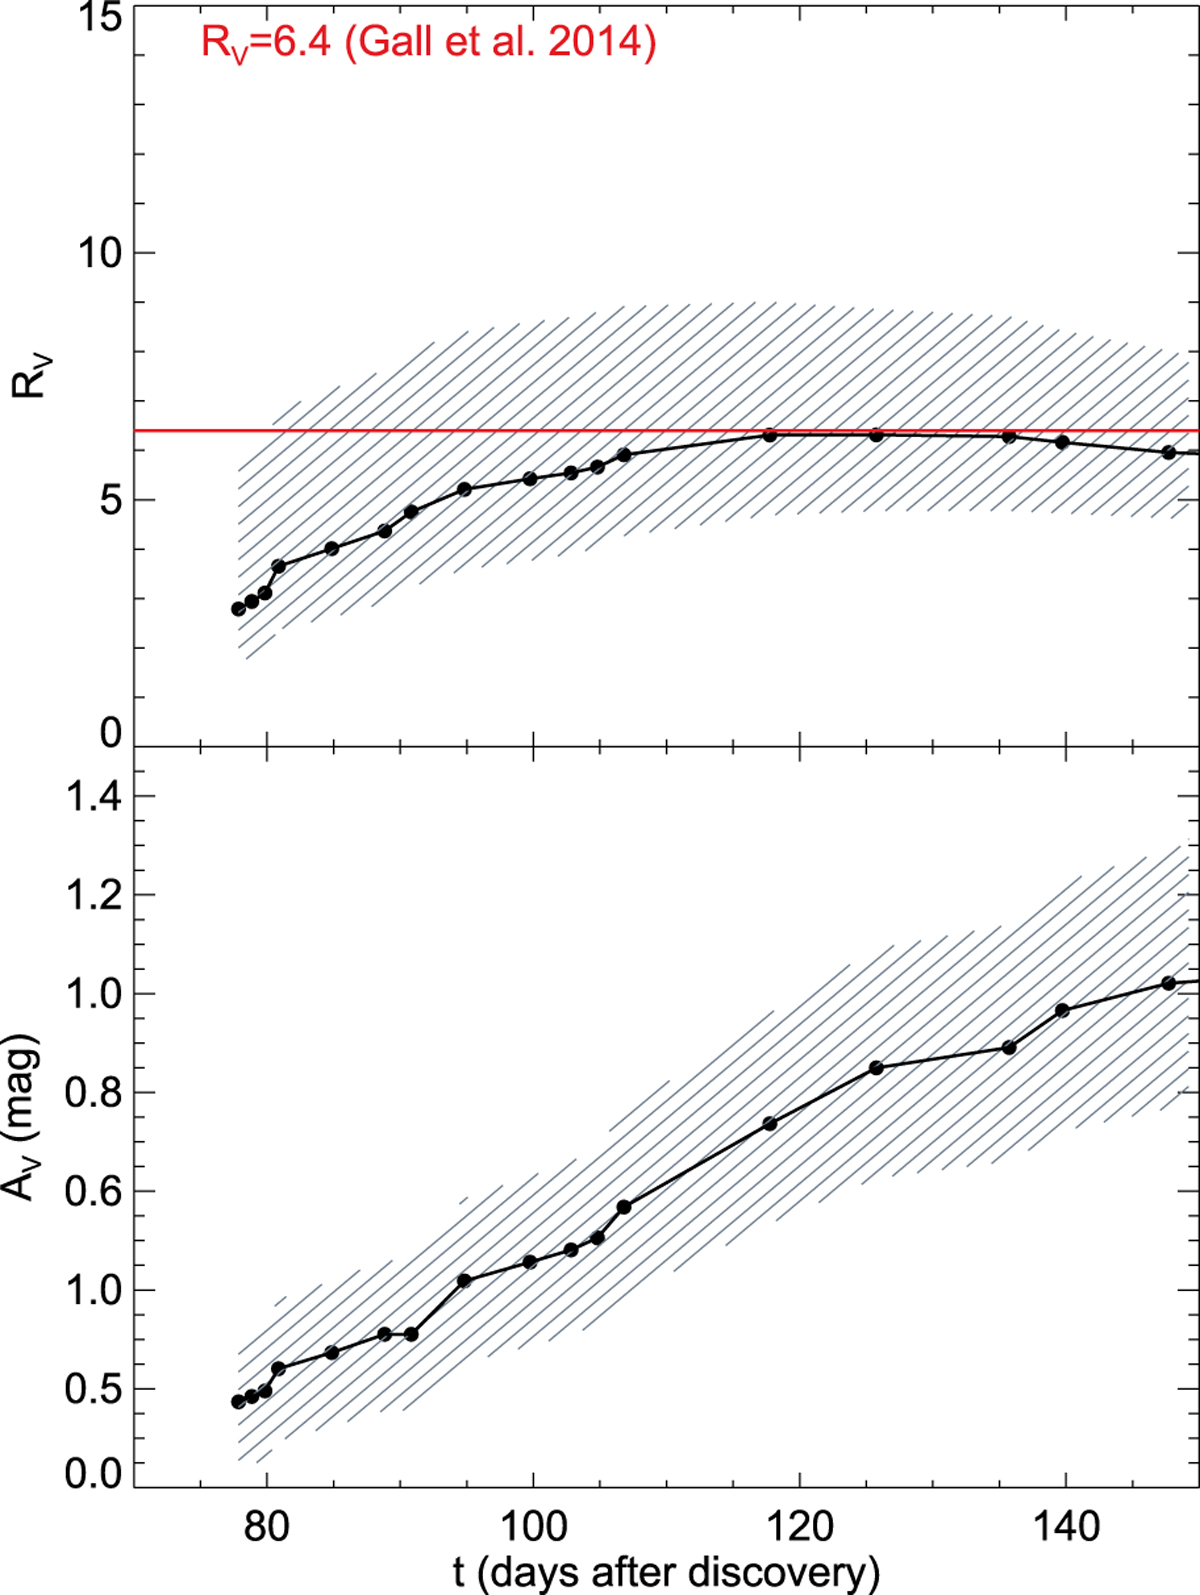
Lowerpanel: AV(connected filled circles) increases monotonically, as expected in the case of dust formation. The shaded area represents the 1σ error region. Upper panel: RVas a function of time. The value of RV= 6.4 found for SN 2010jl (Gall et al. 2014) is indicated as a red horizontal line.
Current usage metrics show cumulative count of Article Views (full-text article views including HTML views, PDF and ePub downloads, according to the available data) and Abstracts Views on Vision4Press platform.
Data correspond to usage on the plateform after 2015. The current usage metrics is available 48-96 hours after online publication and is updated daily on week days.
Initial download of the metrics may take a while.