Fig. 2
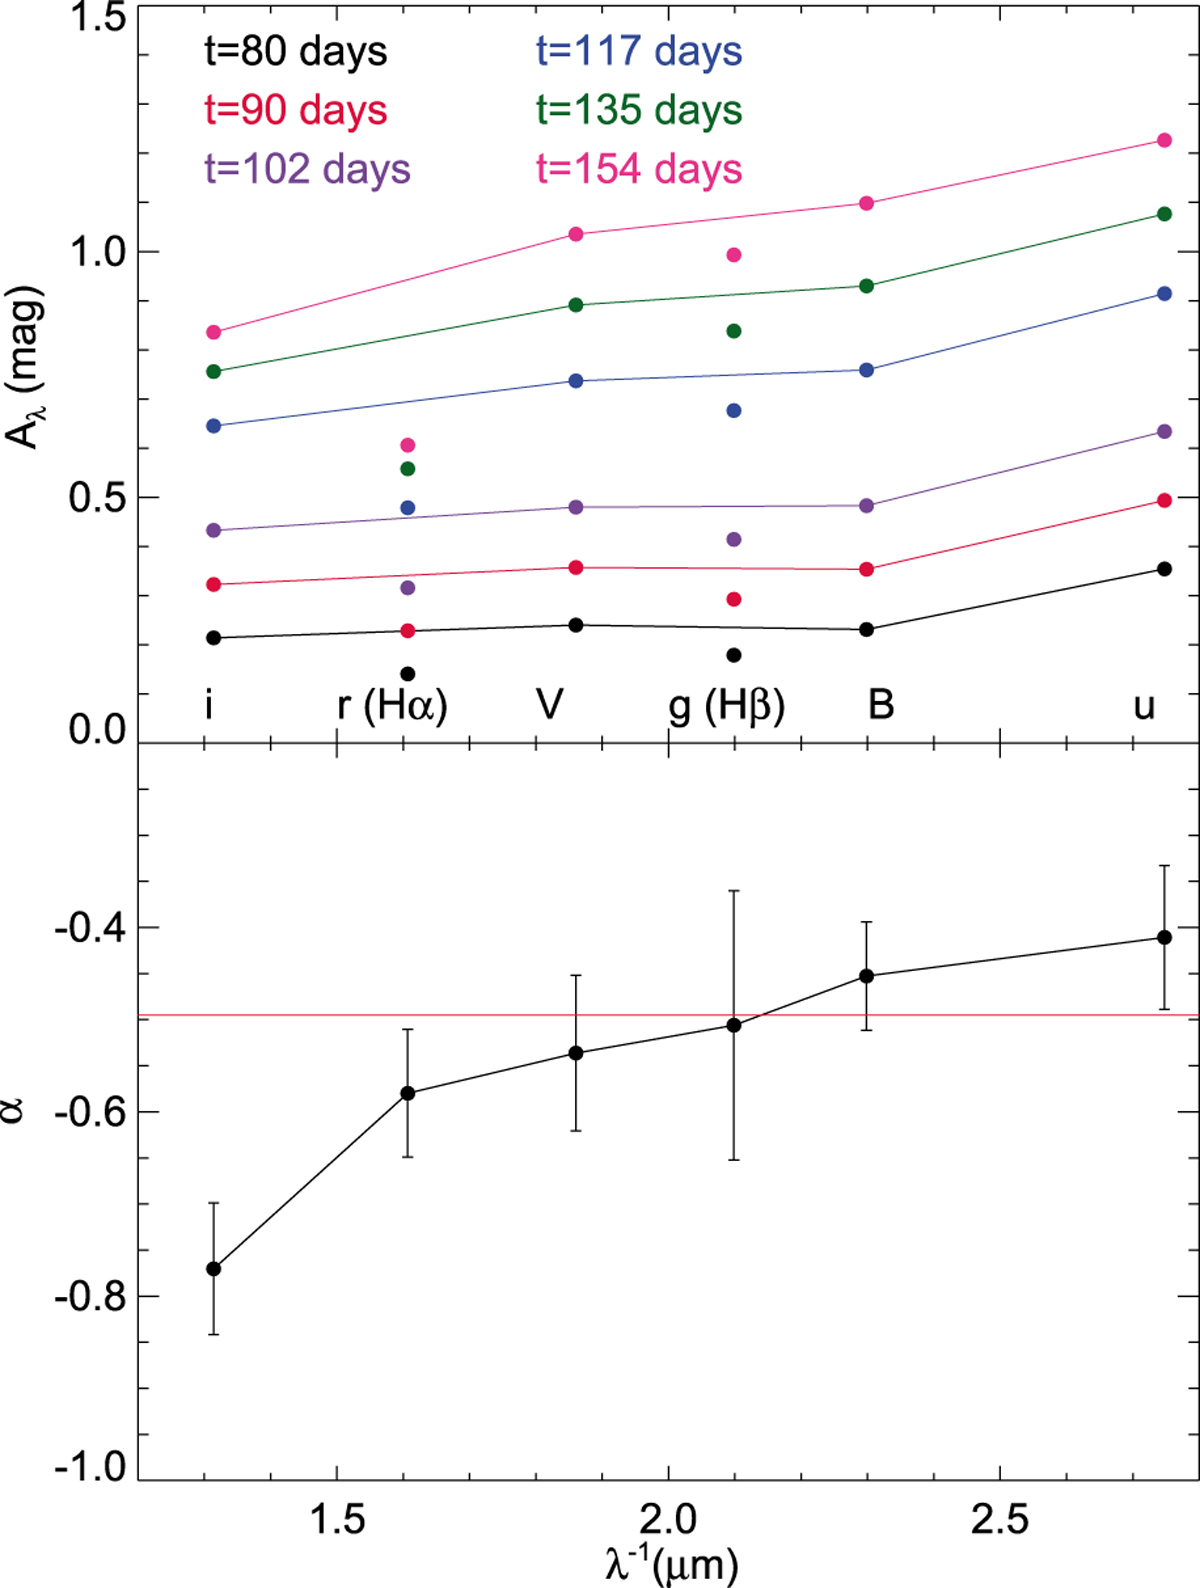
Lower panel: inferred values of α as a function of inverse wavelength. The value of α appears to depend slightly on wavelength. An indicative value of α = −0.49 is shown as a red horizontal line. Upper panel: inferred extinction curves at different times. The optical bands used in the study are indicated. The g band is affected by Hβ emission and the r band is affected by Hα emission. The extinction is seen to increase with time and the extinction curves are fairly flat, suggesting gray extinction.
Current usage metrics show cumulative count of Article Views (full-text article views including HTML views, PDF and ePub downloads, according to the available data) and Abstracts Views on Vision4Press platform.
Data correspond to usage on the plateform after 2015. The current usage metrics is available 48-96 hours after online publication and is updated daily on week days.
Initial download of the metrics may take a while.