Fig. 1
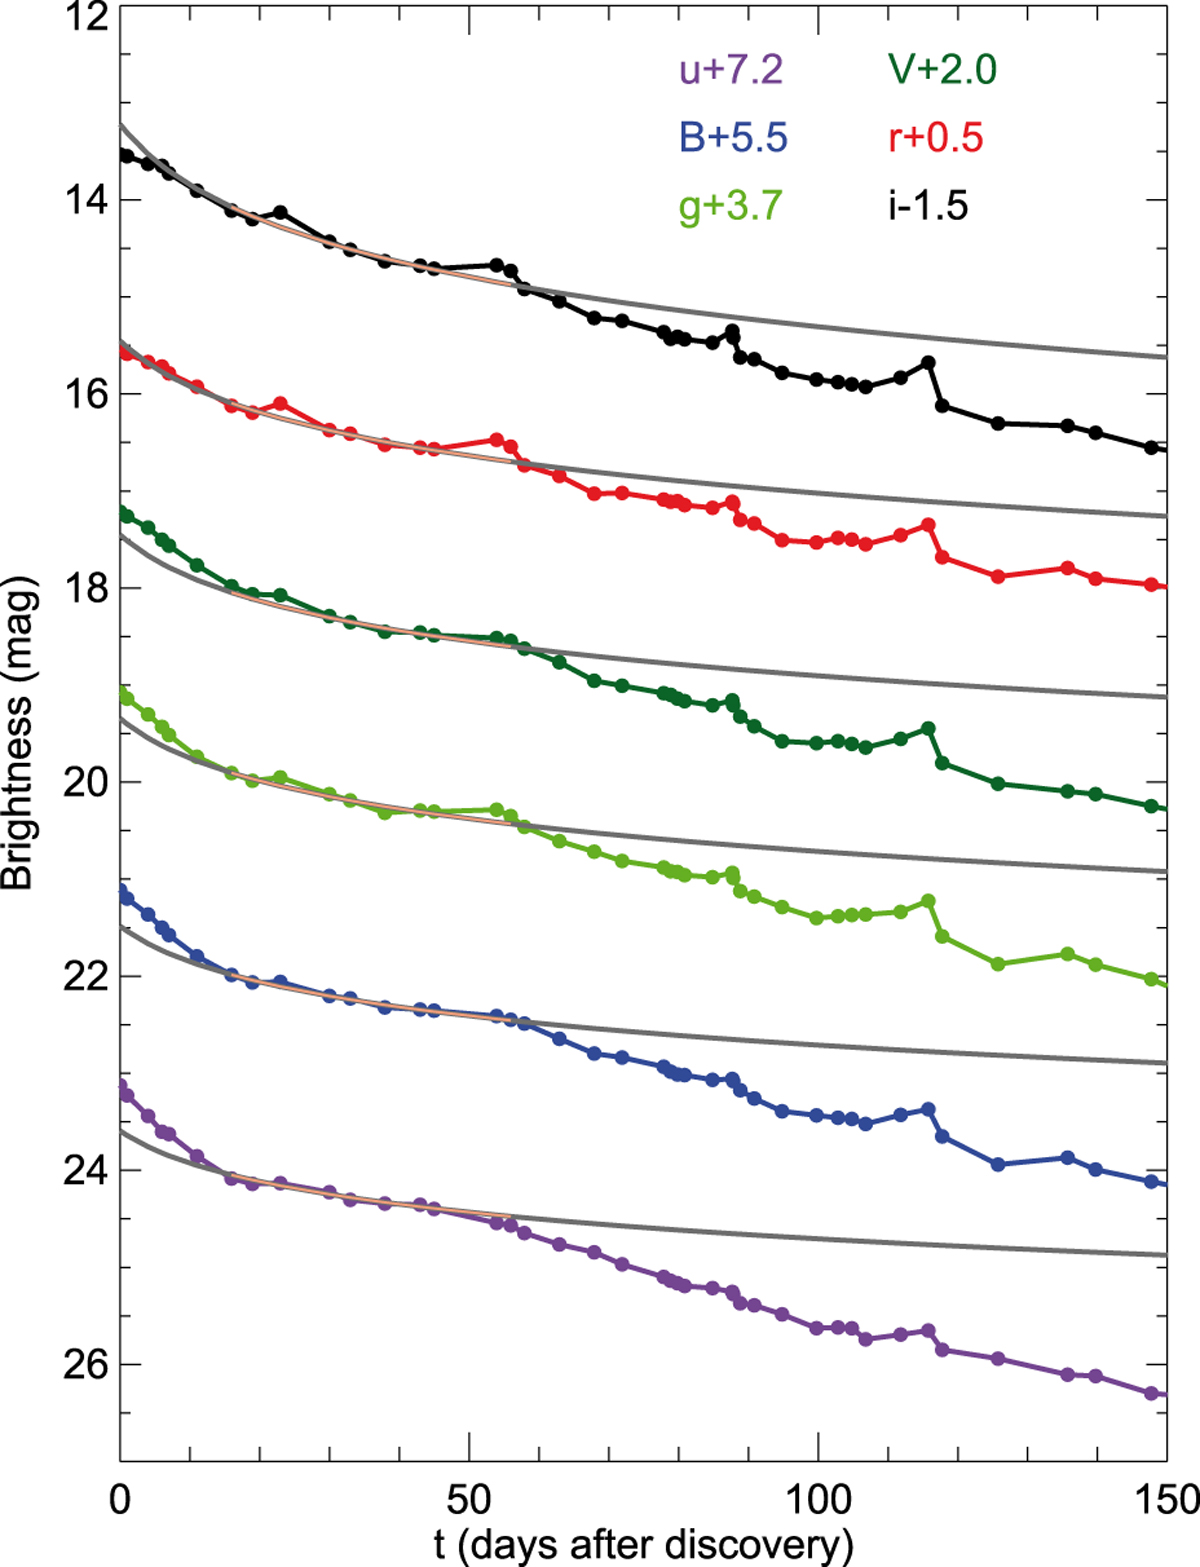
Optical light curves for the type IIn SN 2005ip. The connected colored filled circles represent the observational data (Stritzinger et al. 2012). The light curves exhibit a marked decrease after about +50 days, which is an indication of early dust formation. The gray curves represent fits of a theoretical model (Eq. (1)) to the light curves between +23 and +47 days. The fitting range is highlighted. The model intrinsic light curves are all clearly brighter than the observed light curves from +50 days and onward.
Current usage metrics show cumulative count of Article Views (full-text article views including HTML views, PDF and ePub downloads, according to the available data) and Abstracts Views on Vision4Press platform.
Data correspond to usage on the plateform after 2015. The current usage metrics is available 48-96 hours after online publication and is updated daily on week days.
Initial download of the metrics may take a while.