Free Access
Fig. 5
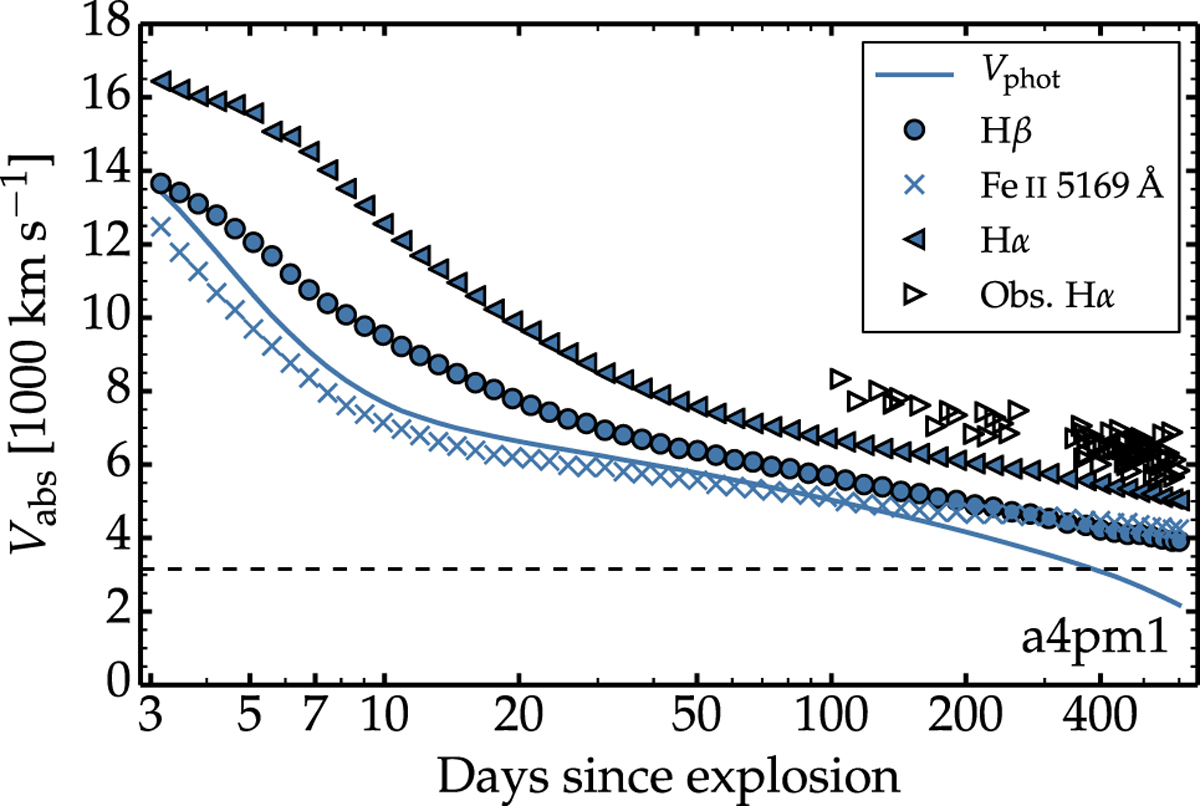
Evolution of the Doppler velocity at maximum absorption in various lines and the photospheric velocity in model a4pm1. I overplot the corresponding values for Hα in iPTF14hls. The x-axis uses a logarithmic scale. The horizontal line gives the ejecta velocity ![]() .
.
Current usage metrics show cumulative count of Article Views (full-text article views including HTML views, PDF and ePub downloads, according to the available data) and Abstracts Views on Vision4Press platform.
Data correspond to usage on the plateform after 2015. The current usage metrics is available 48-96 hours after online publication and is updated daily on week days.
Initial download of the metrics may take a while.