Free Access
Fig. 4
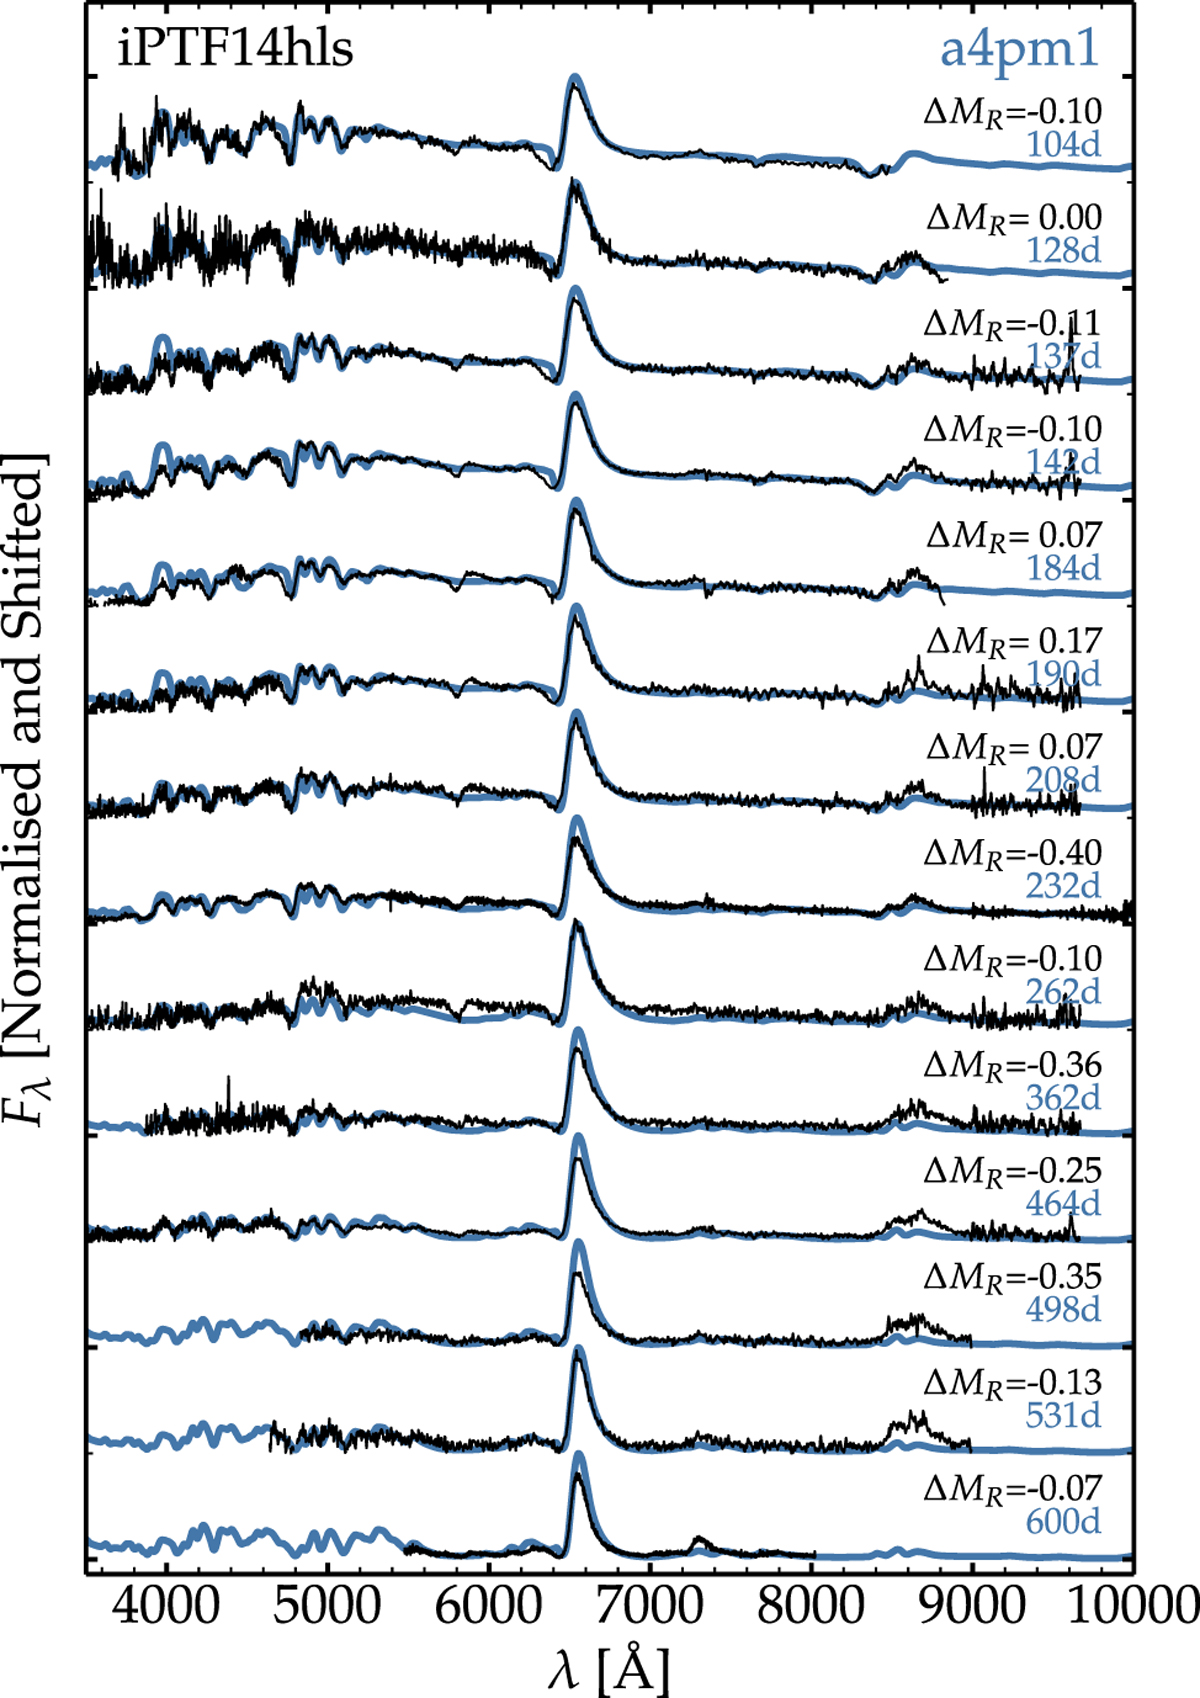
Comparison of the multi-epoch spectra of SLSN iPTF14hls with model a4pm1. Times and wavelengths are given in the rest frame. Model and observations are renormalized at 6800 Å. For each date, I give the R-band magnitude offset (see also Fig. 1).
Current usage metrics show cumulative count of Article Views (full-text article views including HTML views, PDF and ePub downloads, according to the available data) and Abstracts Views on Vision4Press platform.
Data correspond to usage on the plateform after 2015. The current usage metrics is available 48-96 hours after online publication and is updated daily on week days.
Initial download of the metrics may take a while.