Fig. 5
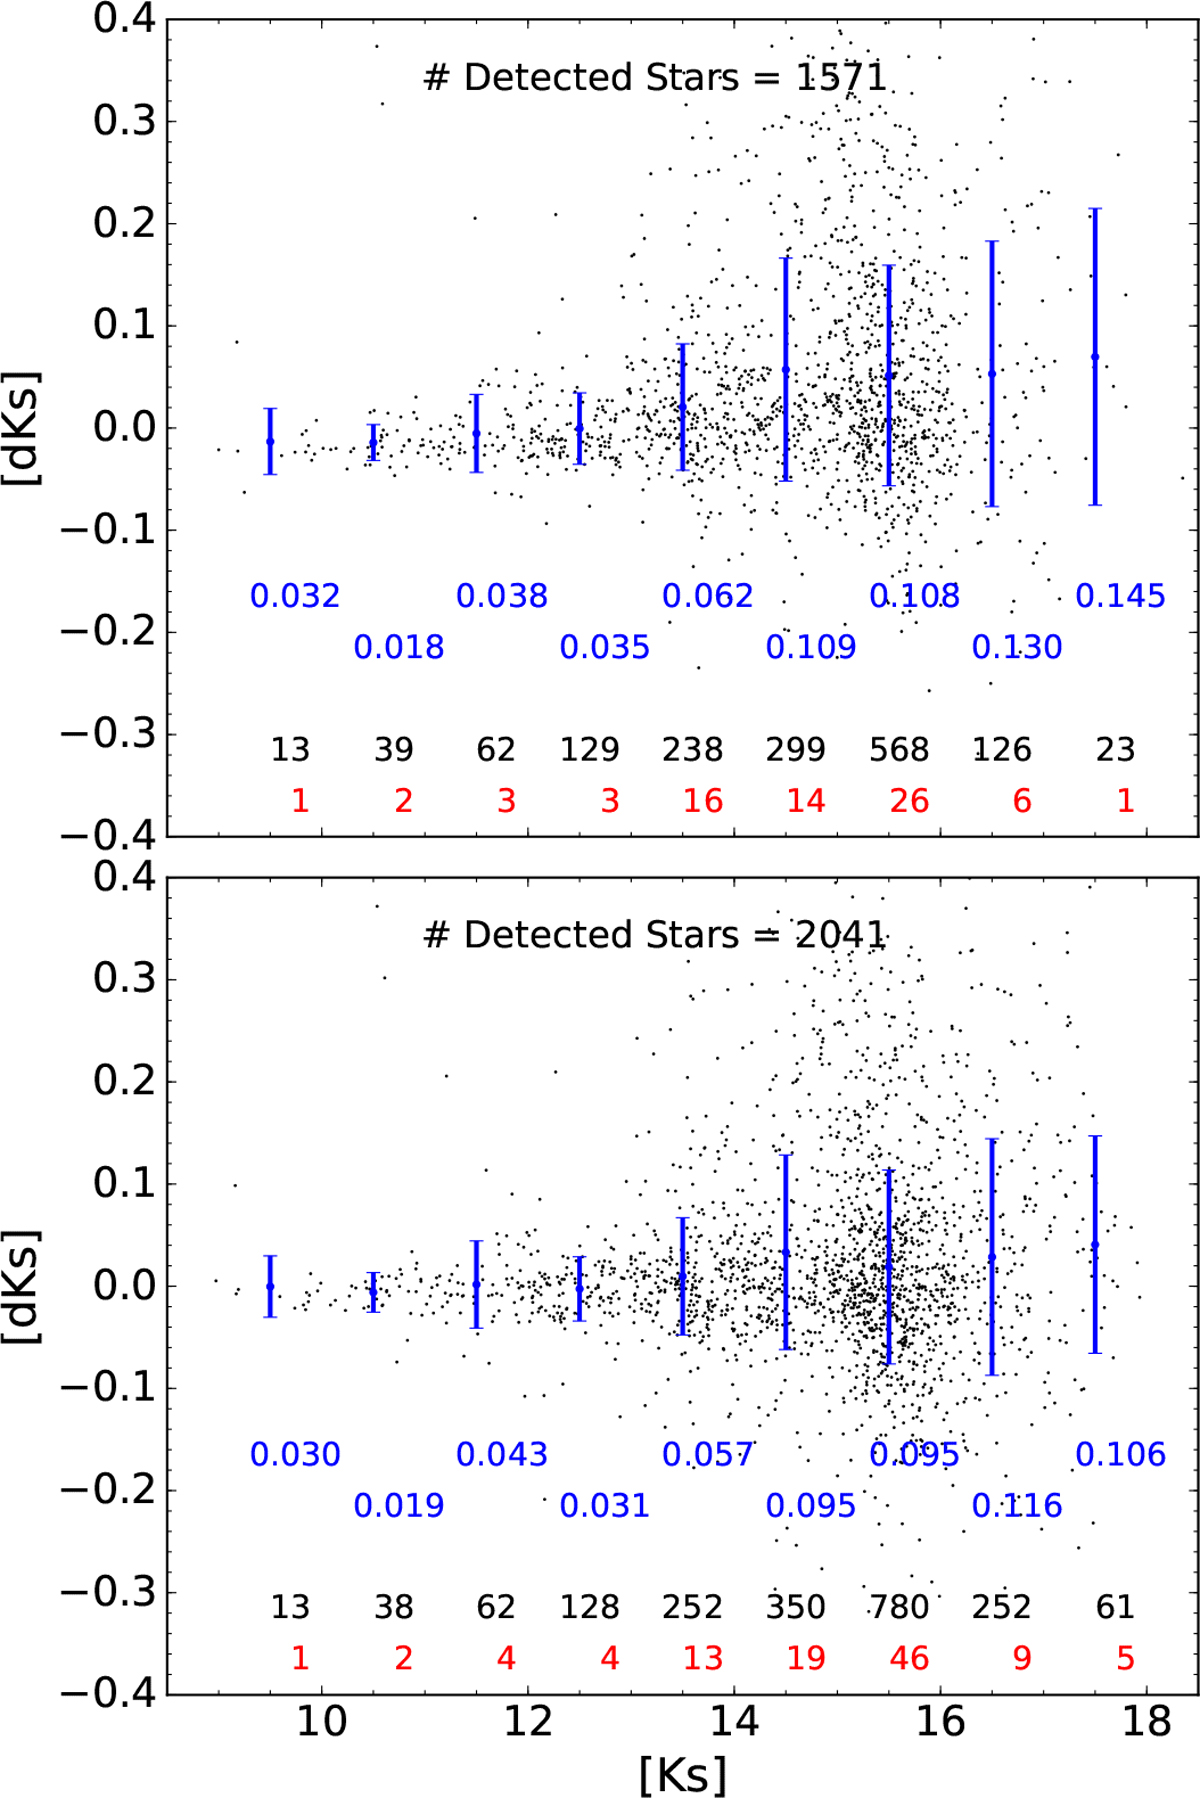
Photometric precision for simulated data with different rebinning factors. The upper and lower panels show results for rebinning factors of 1 and 2, respectively. Blue error bars depict the standard deviation of the points in bins of one magnitude. The first row of numbers are the standard deviation in those bins. The second and third rows are the number of points used to compute the standard deviation and the number of rejected outliers.
Current usage metrics show cumulative count of Article Views (full-text article views including HTML views, PDF and ePub downloads, according to the available data) and Abstracts Views on Vision4Press platform.
Data correspond to usage on the plateform after 2015. The current usage metrics is available 48-96 hours after online publication and is updated daily on week days.
Initial download of the metrics may take a while.