Free Access
Fig. A.4
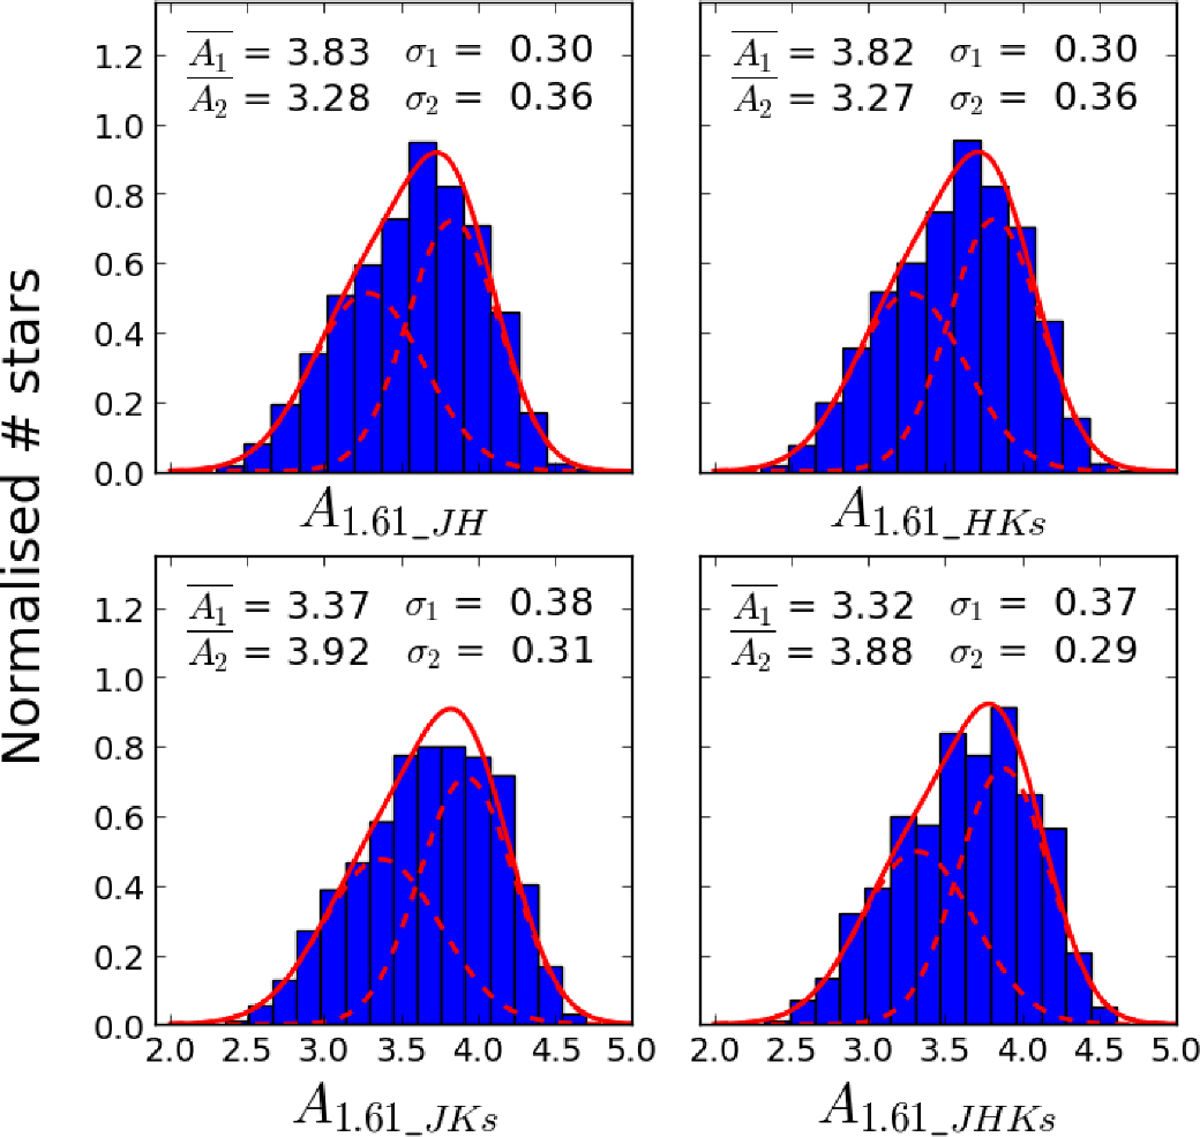
Normalised histograms of A1.61 computed with the grid method for all the RC stars. The red continuous line shows two-Gaussian fits and the red dashed lines show the individual Gaussians of the fit. The mean and standard deviations of the fits are annotated in the plots.
Current usage metrics show cumulative count of Article Views (full-text article views including HTML views, PDF and ePub downloads, according to the available data) and Abstracts Views on Vision4Press platform.
Data correspond to usage on the plateform after 2015. The current usage metrics is available 48-96 hours after online publication and is updated daily on week days.
Initial download of the metrics may take a while.