Free Access
Fig. 34
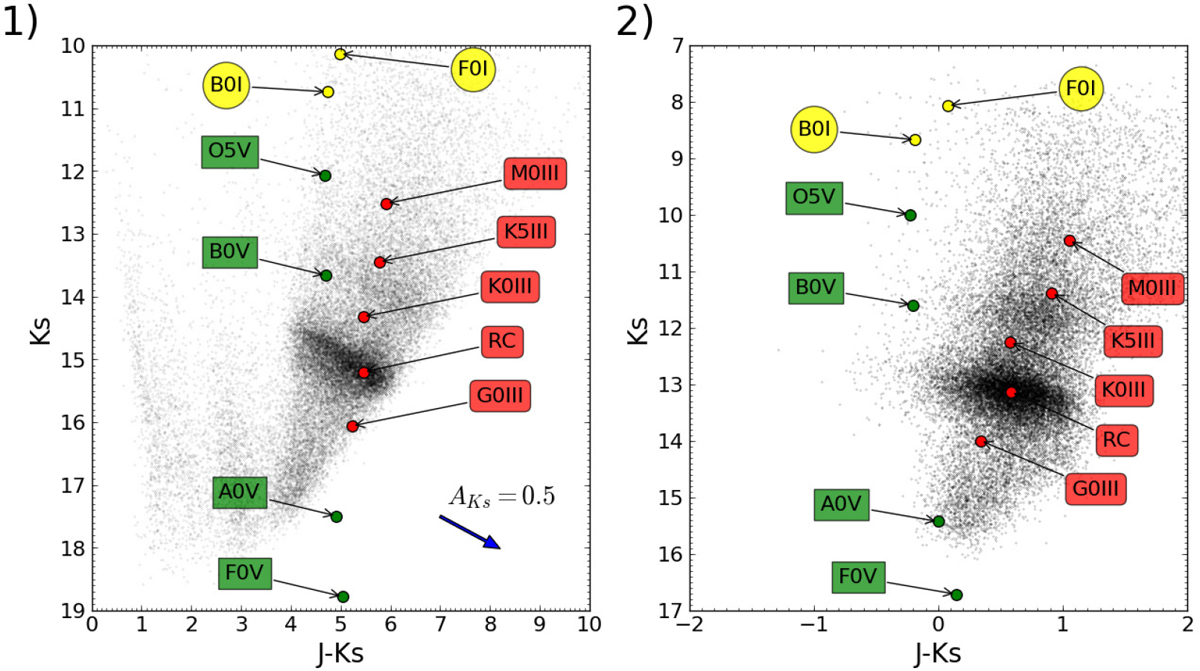
Panel 1: CMD Ks vs. J − Ks. We have overplotted several Kurucz stellar models (assuming a mean extinction A1.61 =3.97, see Sect. 6.1) to identify the expected position of those stars. Panel 2: dereddened map once we have applied the extinction maps. Both panels have different scales on the X-axis.
Current usage metrics show cumulative count of Article Views (full-text article views including HTML views, PDF and ePub downloads, according to the available data) and Abstracts Views on Vision4Press platform.
Data correspond to usage on the plateform after 2015. The current usage metrics is available 48-96 hours after online publication and is updated daily on week days.
Initial download of the metrics may take a while.