Free Access
Fig. 28
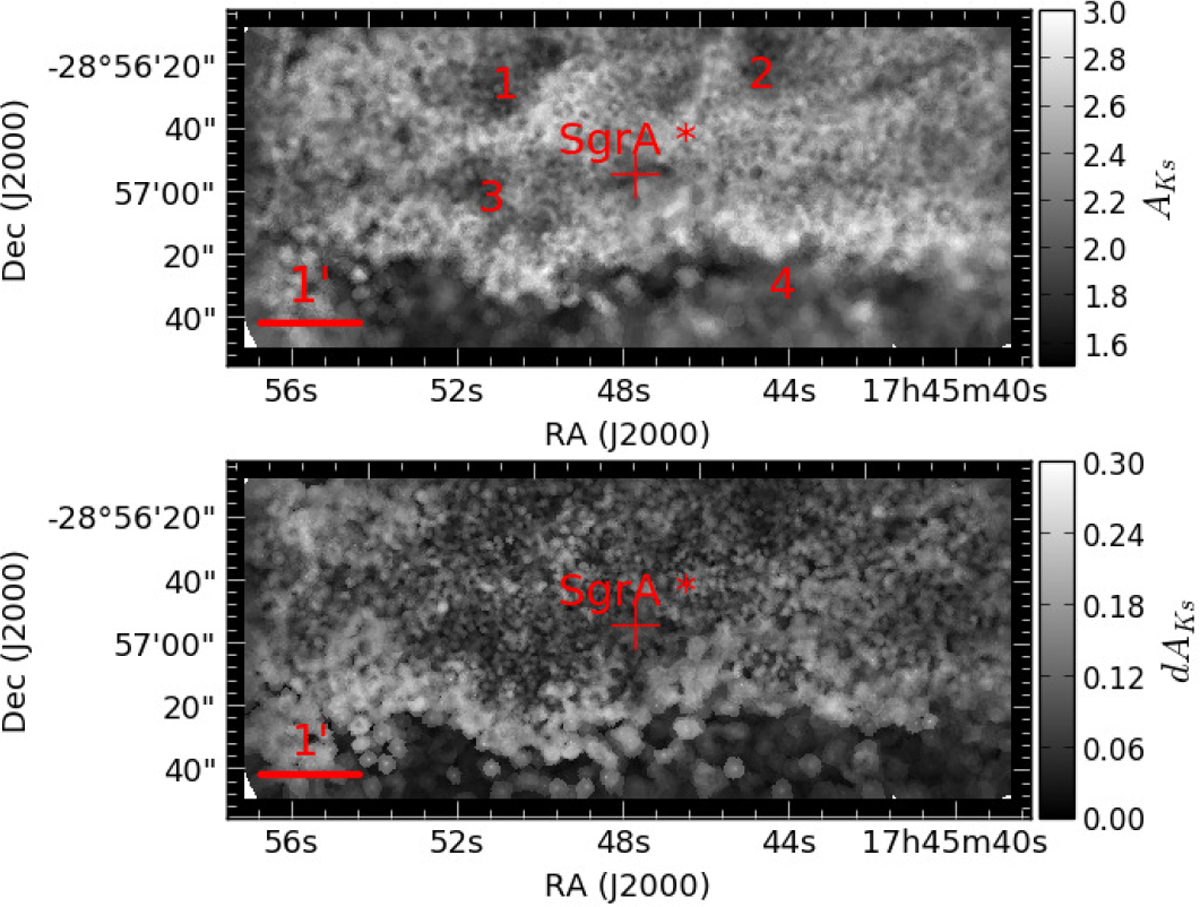
Upper panel: extinction map AKS obtained using all the RC stars shown in Fig. 14. Lower panel: corresponding uncertainty map. The numbers in red indicate regions to be compared between the different extinction maps (see main text).
Current usage metrics show cumulative count of Article Views (full-text article views including HTML views, PDF and ePub downloads, according to the available data) and Abstracts Views on Vision4Press platform.
Data correspond to usage on the plateform after 2015. The current usage metrics is available 48-96 hours after online publication and is updated daily on week days.
Initial download of the metrics may take a while.