Free Access
Fig. 27
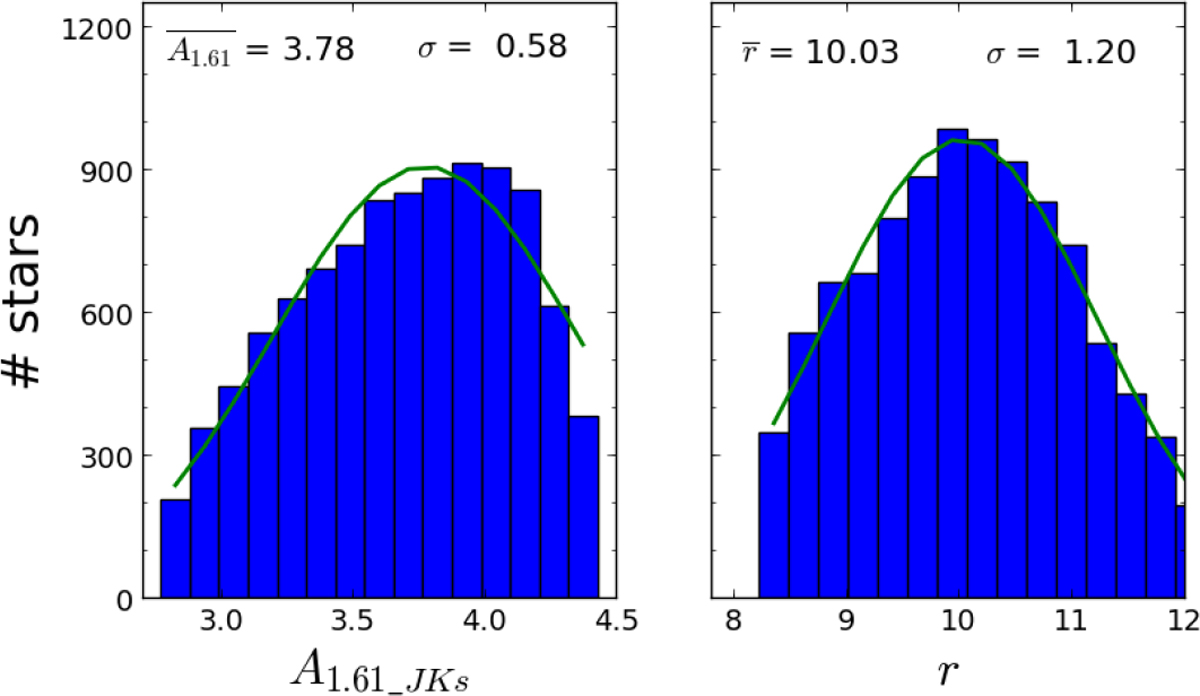
Left panel: A1.61_JKs distribution computed for all the RC stars. Right panel: radii distribution of the RC stars (in solar radii). The green line shows a Gaussian fit, with mean and standard deviation indicated in the legend.
Current usage metrics show cumulative count of Article Views (full-text article views including HTML views, PDF and ePub downloads, according to the available data) and Abstracts Views on Vision4Press platform.
Data correspond to usage on the plateform after 2015. The current usage metrics is available 48-96 hours after online publication and is updated daily on week days.
Initial download of the metrics may take a while.