Free Access
Fig. 22
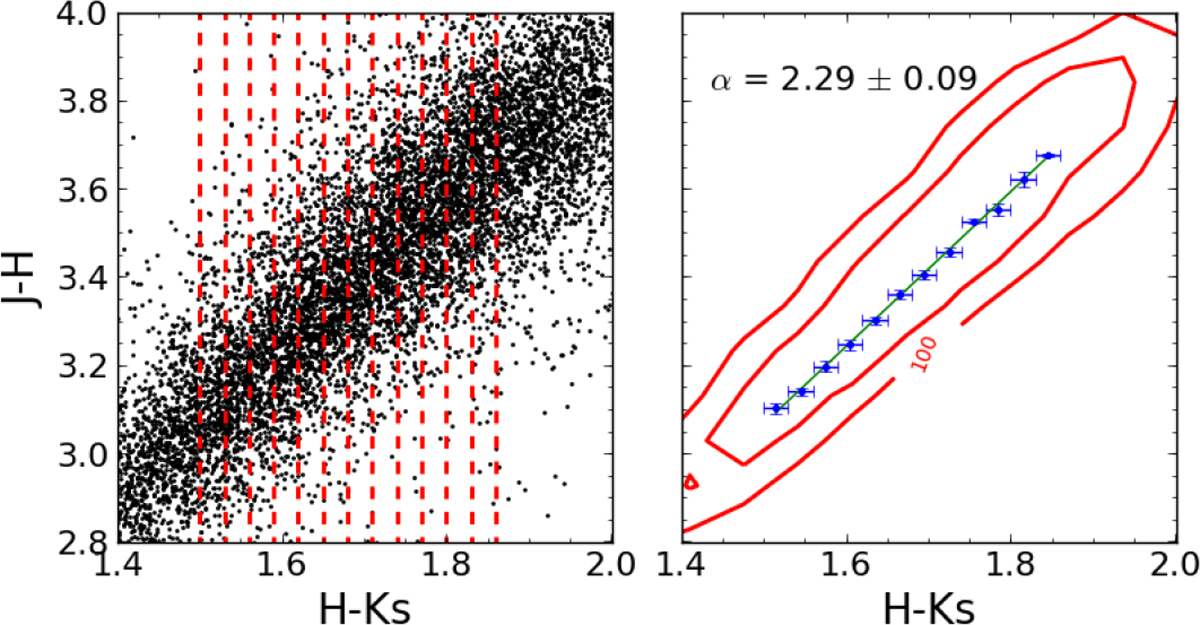
Calculation of αJHKs using the distribution of the RC stars in the CCD. Left panel shows the cloud of points and the bins used to computed the slope. Right panel depicts the obtained points using the bins. The green line is the best fit and red contours depict the density distribution of the cloud of points.
Current usage metrics show cumulative count of Article Views (full-text article views including HTML views, PDF and ePub downloads, according to the available data) and Abstracts Views on Vision4Press platform.
Data correspond to usage on the plateform after 2015. The current usage metrics is available 48-96 hours after online publication and is updated daily on week days.
Initial download of the metrics may take a while.