Fig. 2
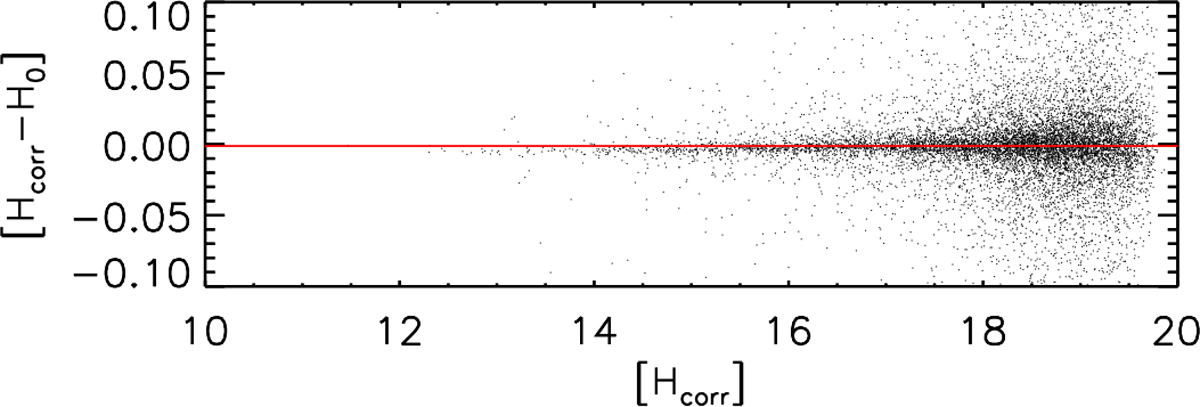
Difference in H-band photometry before and after applying the distortion solution. The results of the photometry computed before and after the application of the distortion solution are indicated by H0 and Hcorr, respectively. This plot corresponds to detector #3 of D15 data. The units are magnitudes, with the zero point being the one specified in the HAWK-I user manual.
Current usage metrics show cumulative count of Article Views (full-text article views including HTML views, PDF and ePub downloads, according to the available data) and Abstracts Views on Vision4Press platform.
Data correspond to usage on the plateform after 2015. The current usage metrics is available 48-96 hours after online publication and is updated daily on week days.
Initial download of the metrics may take a while.