Fig. 16
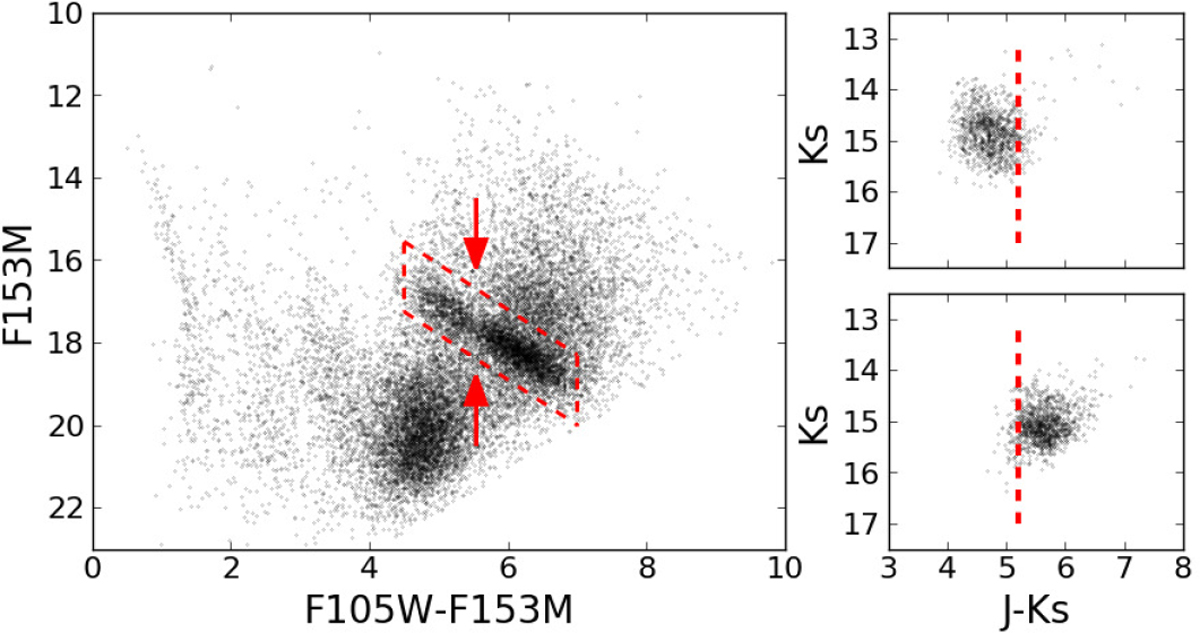
Leftpanel: colour-magnitude diagram F153M vs. F105W – F153M. The red dashed parallelogram traces theRC and the red arrows mark an obvious gap in the distribution of the RC stars, which follows the reddening vector. The upper right panel depicts stars from our HAWK-I catalogue in J and Ks with counterpart in the HST data in the first detected bump. Analogously, the lower panel represents stars located in the second bump.
Current usage metrics show cumulative count of Article Views (full-text article views including HTML views, PDF and ePub downloads, according to the available data) and Abstracts Views on Vision4Press platform.
Data correspond to usage on the plateform after 2015. The current usage metrics is available 48-96 hours after online publication and is updated daily on week days.
Initial download of the metrics may take a while.