Fig. 14
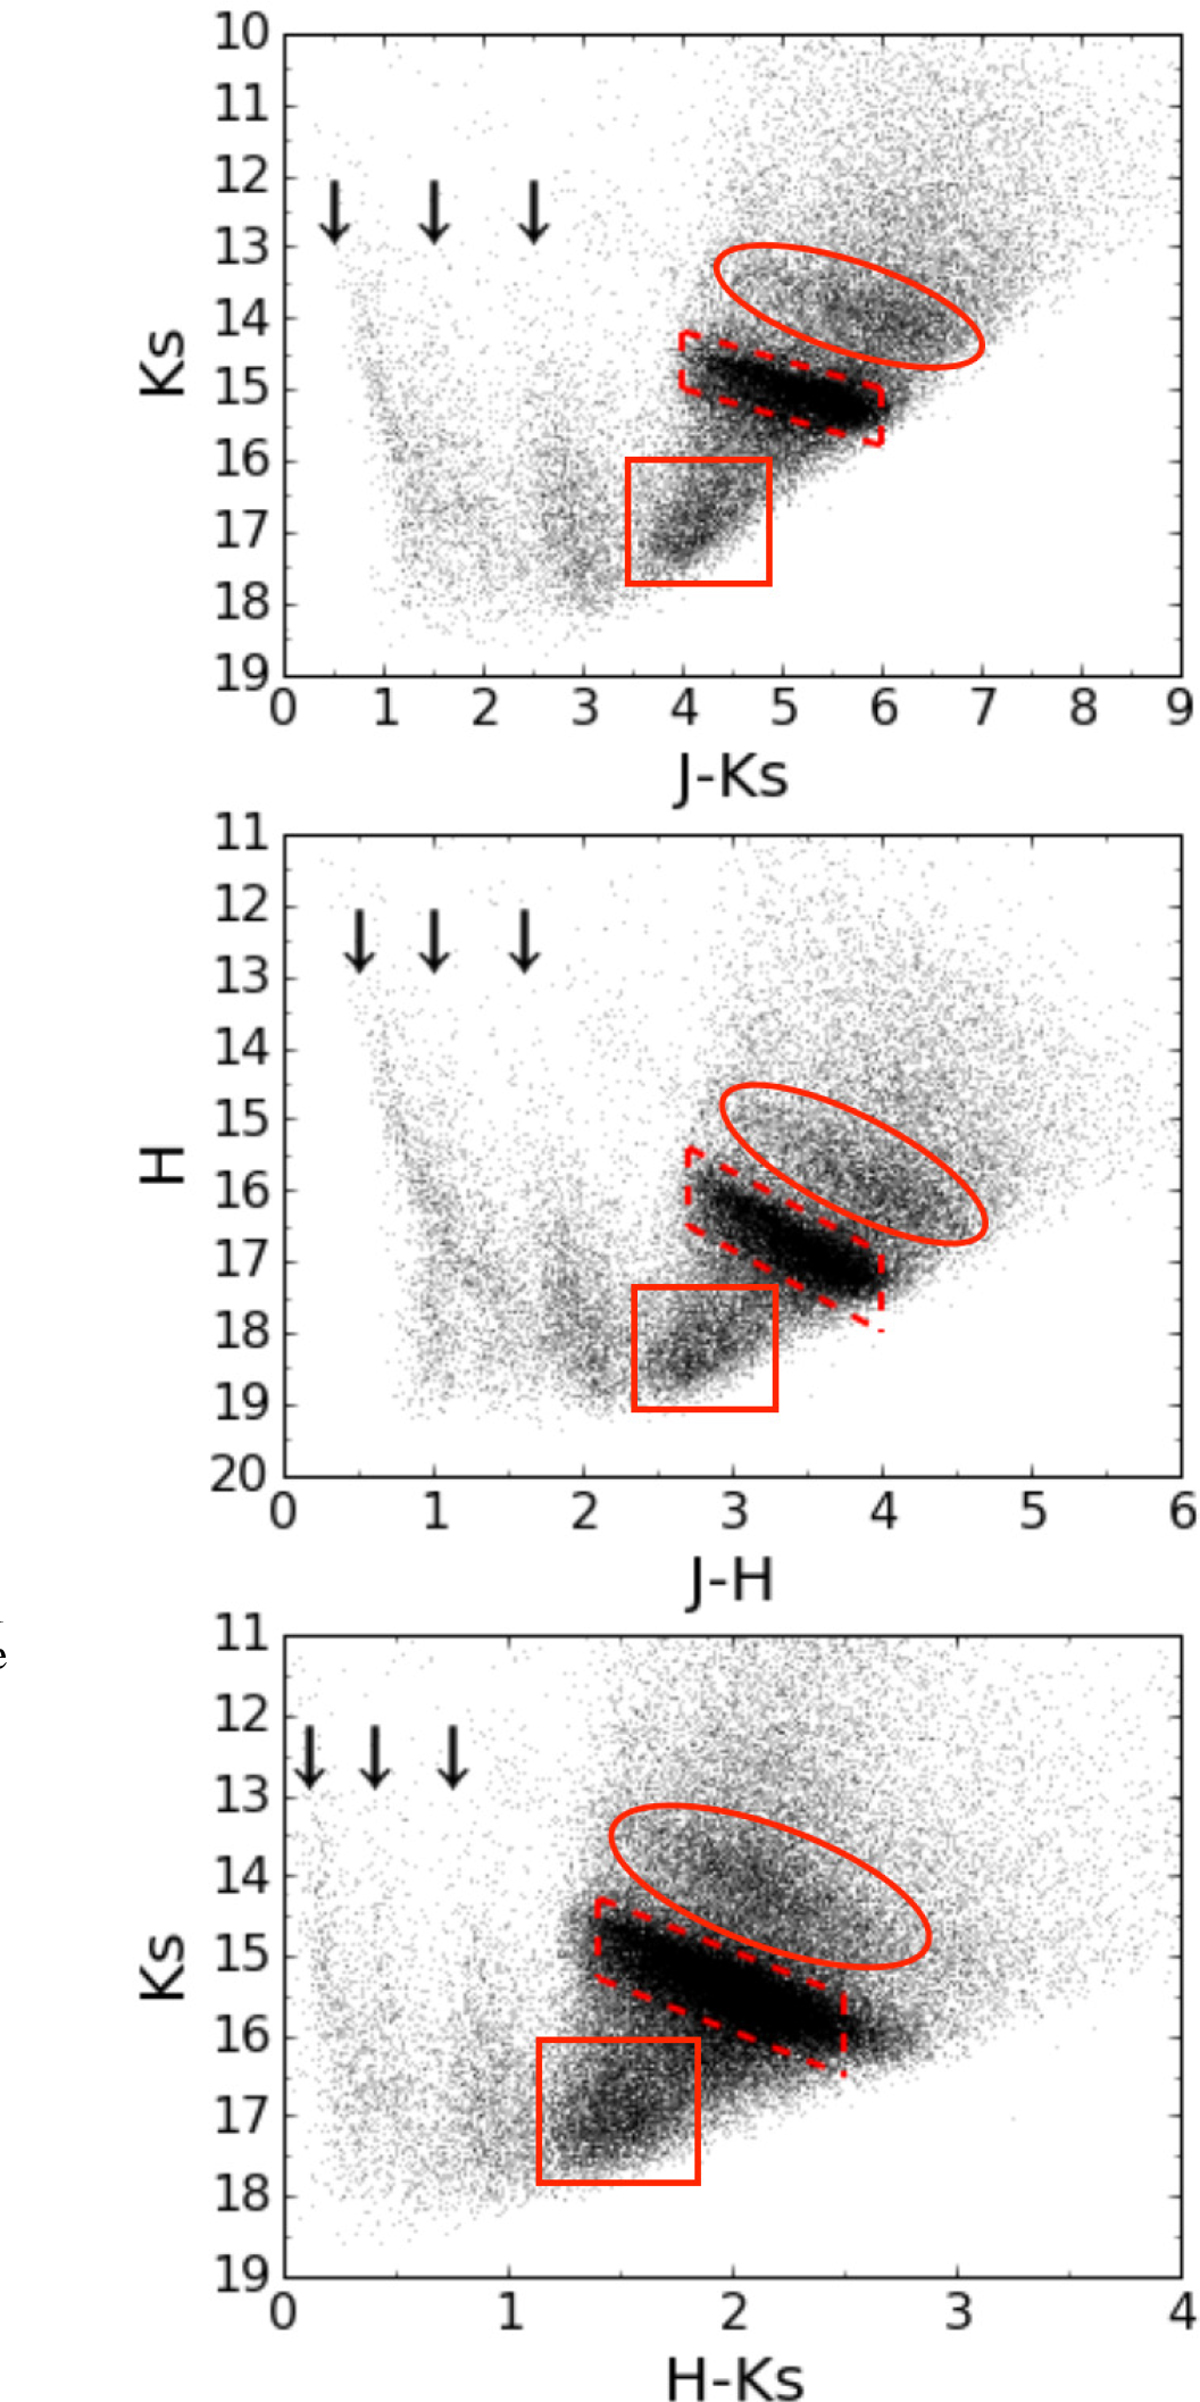
Colour-magnitude diagrams for Ks vs. J − Ks, H vs. J − H, and Ks vs. H −Ks (D15 data). The red dashed parallelograms indicate the red clump, the red ellipse marks stars that belong to the asymptotic giant branch bump and the red square contains ascending giant branch and post-main sequence stars. The three black arrows indicate foreground stellar population probably tracing spiral arms.
Current usage metrics show cumulative count of Article Views (full-text article views including HTML views, PDF and ePub downloads, according to the available data) and Abstracts Views on Vision4Press platform.
Data correspond to usage on the plateform after 2015. The current usage metrics is available 48-96 hours after online publication and is updated daily on week days.
Initial download of the metrics may take a while.