Fig. 10
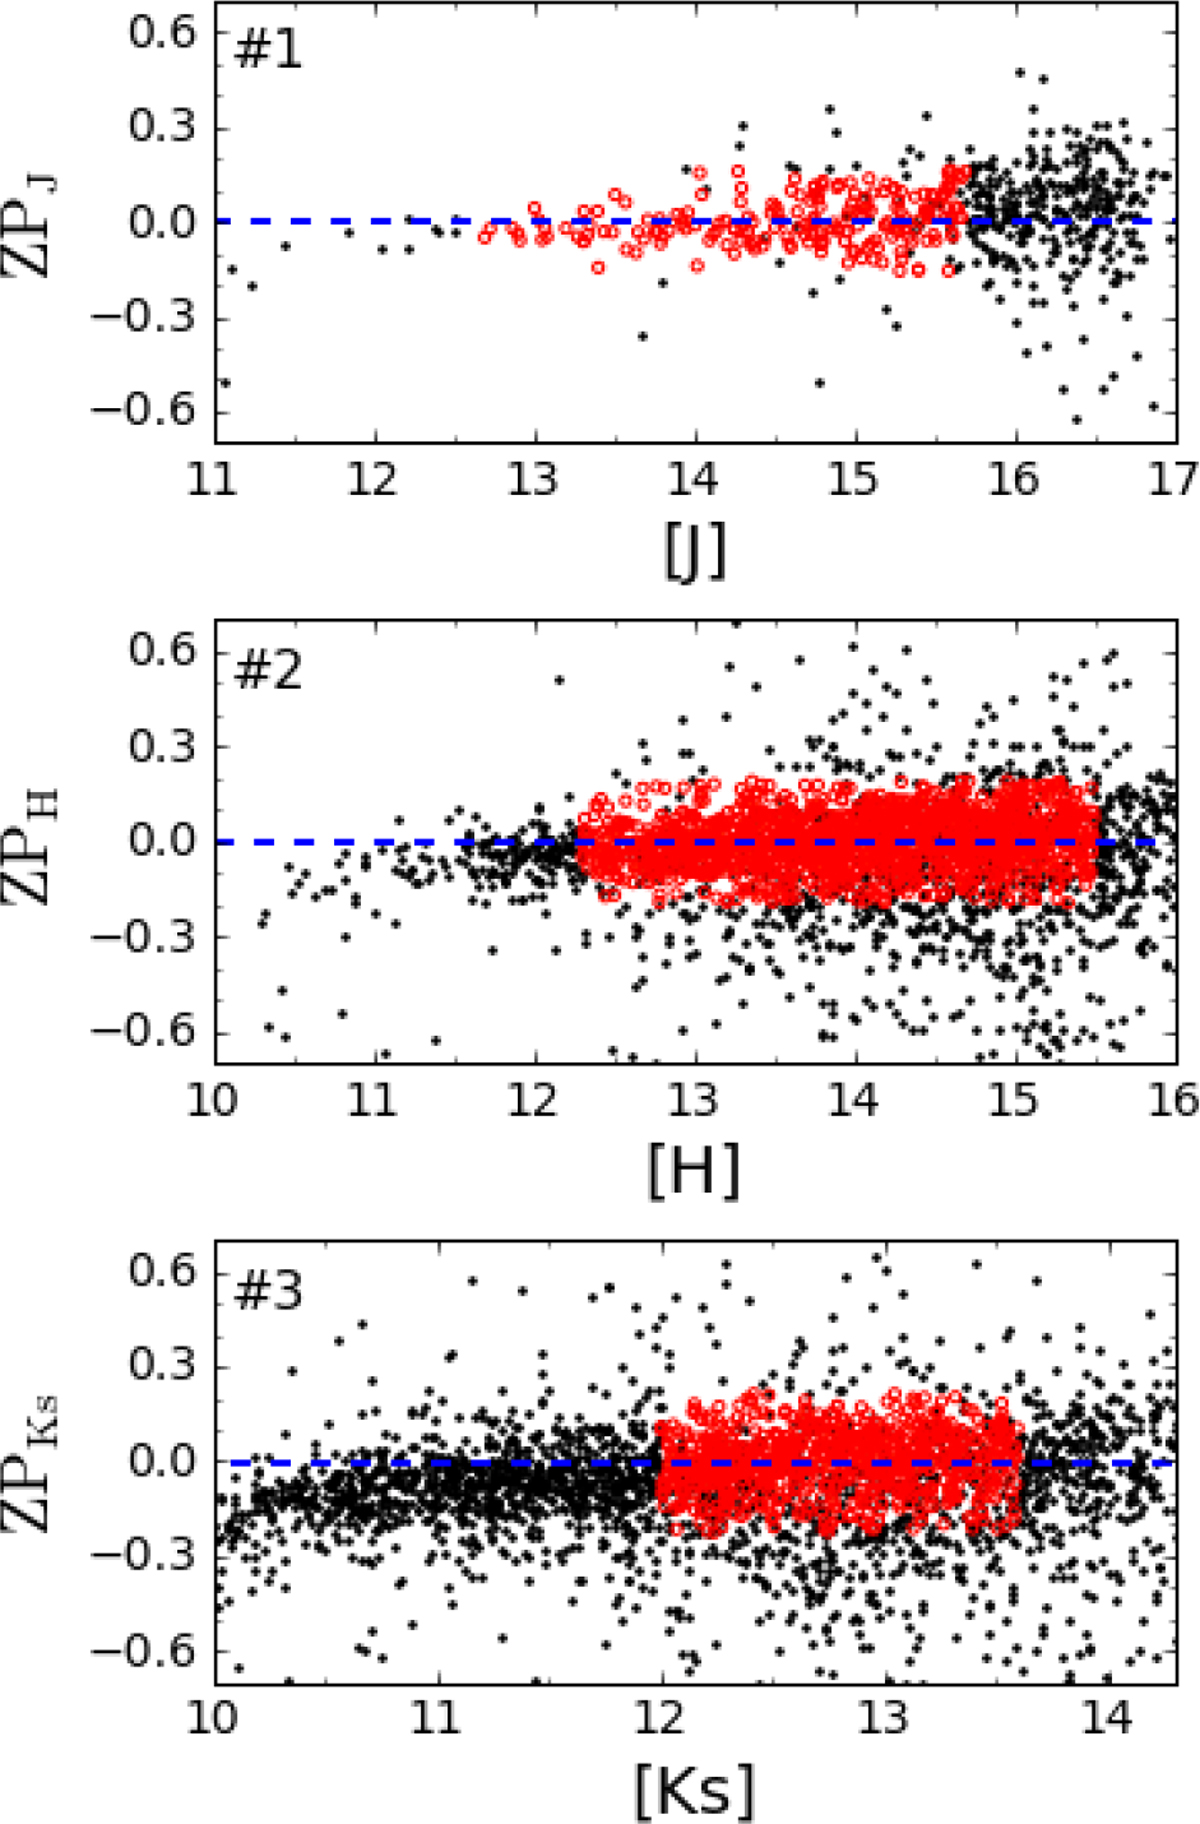
Zero points calculated in all three bands after merging the list for every chip and pointing (D15). Black points represent allthe common stars between the SIRIUS catalogue and our data. Red points depict the stars used to compute the zero point and the blue line is its average. Systematic deviations for the brightest stars are due to saturation.
Current usage metrics show cumulative count of Article Views (full-text article views including HTML views, PDF and ePub downloads, according to the available data) and Abstracts Views on Vision4Press platform.
Data correspond to usage on the plateform after 2015. The current usage metrics is available 48-96 hours after online publication and is updated daily on week days.
Initial download of the metrics may take a while.