Fig. 9
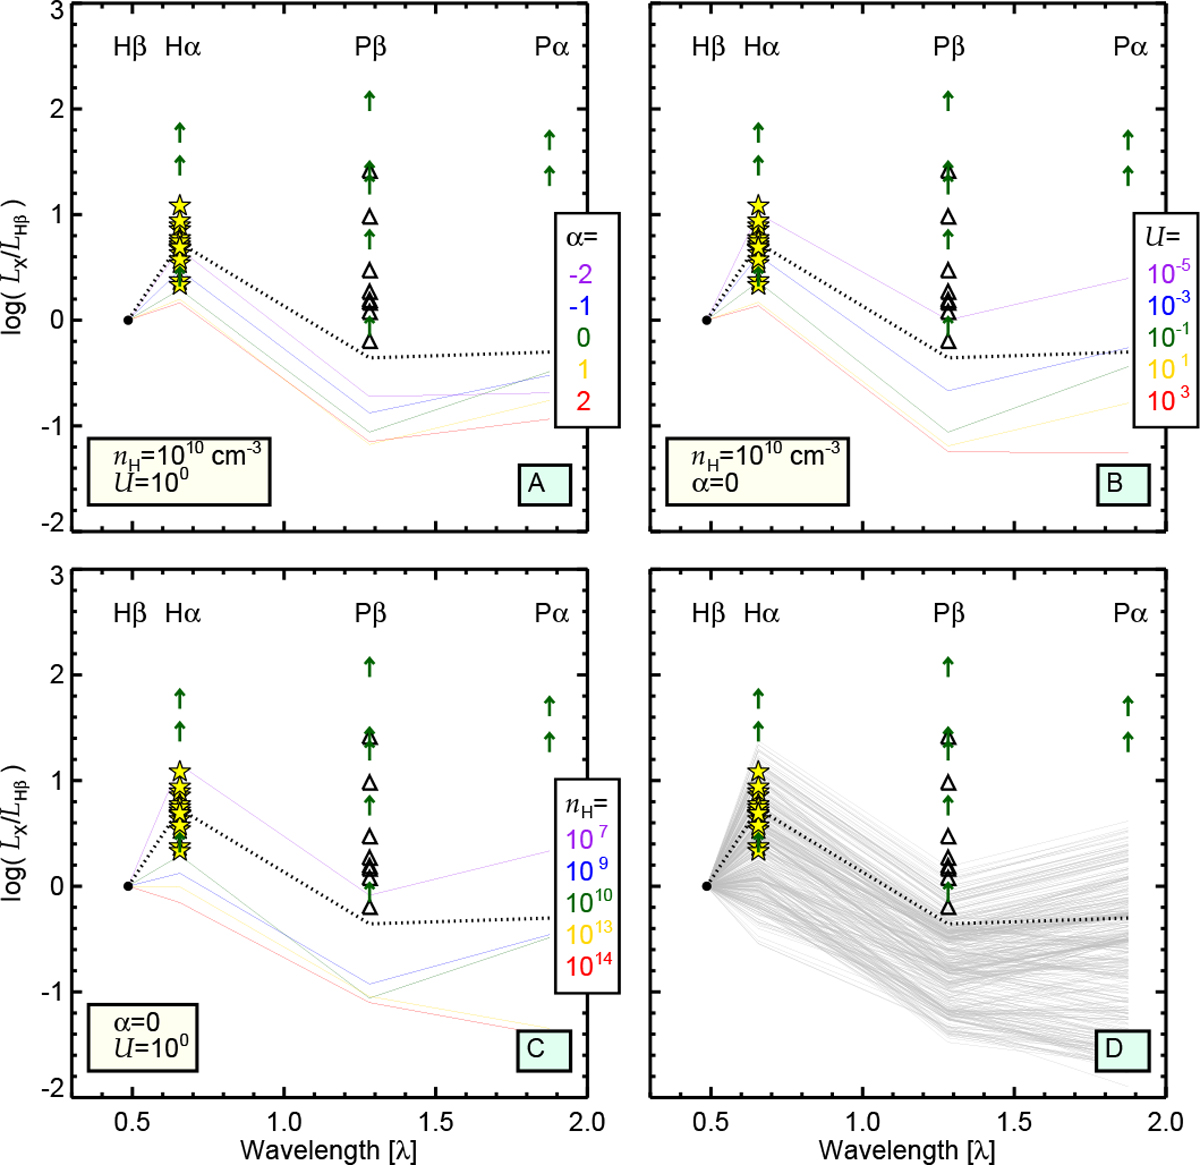
Line luminosity ratios of Hα, Pβ, and Pα with respect to Hβ of red quasars. The Pβ/Hβ luminosity ratios of eight red quasars are indicated by the open triangles, and the yellow stars are the Hα/Hβ luminosity ratios of the local red AGNs from Rose et al. (2013). The green arrows indicate the lower limits. Thedotted line is the line luminosity ratio reproduced by the CLOUDY code with a set of parameters (α = −1.0, U = 10−1.5, and nH= 109 cm−3), which is consistent with the line luminosity ratios of unobscured type 1 quasars from Hβ to Pα (Kim et al. 2010). Panel A: the five colored solid lines represent the line luminosity ratios from the CLOUDY code with nH = 1010 cm−3, U = 100, and various α from − 2 to 2. The various α is represented by color, i.e., the purple, blue, green, yellow, and red lines indicate α is − 2, − 1, 0, 1, and 2, respectively. Panel B: the meanings of the symbols and lines are identical to panel A, but the five colored lines are the line luminosity ratios with nH = 1010 cm−3, α = 0, and various U from 10−5 to 103. Panel C: the meanings of the symbols and lines are identical to panel A, but the five colored lines are the line luminosity ratios with α = 0, U = 100, and various nH from 107 to 1014 cm−3. Panel D: the meanings of the symbols and the dotted line are identical to panel A, and the gray lines represent the line luminosity ratios computed from the CLOUDY code with various physical conditions, within α = −2 to 2, nH = 107−1014 cm−3, and U = 10−5−105.
Current usage metrics show cumulative count of Article Views (full-text article views including HTML views, PDF and ePub downloads, according to the available data) and Abstracts Views on Vision4Press platform.
Data correspond to usage on the plateform after 2015. The current usage metrics is available 48-96 hours after online publication and is updated daily on week days.
Initial download of the metrics may take a while.