Fig. 8
Left: comparison between the continuum-based and the line ratio-based E(B − V) values of red quasars. The ![]() values are composed of
values are composed of ![]() and
and ![]() values. The
values. The ![]() and
and ![]() are represented by the circles and squares, respectively. The
are represented by the circles and squares, respectively. The ![]() values are adopted from previous studies (Glikman et al. 2007; Urrutia et al. 2009), for which uncertainties for some of the values are not available. The red and blue colors indicating the
values are adopted from previous studies (Glikman et al. 2007; Urrutia et al. 2009), for which uncertainties for some of the values are not available. The red and blue colors indicating the ![]() values are adopted from Urrutia et al. (2009) and Glikman et al. (2007), respectively. The arrows representing the
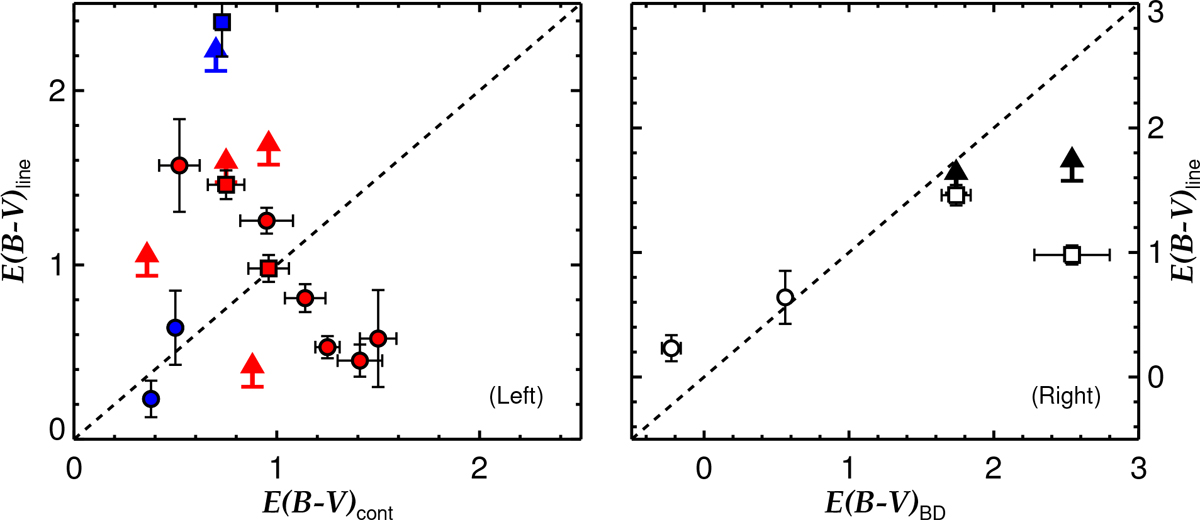
values are adopted from Urrutia et al. (2009) and Glikman et al. (2007), respectively. The arrows representing the ![]() values are measured using the upper limits luminosities of Hβ and LP β, and their colors have the same meanings. The dashed line indicates a line where the two values are identical. The correlation between these two quantities are nonexistent, suggesting large uncertainties that are associated with the determination of the dust extinction from the continuum that may be affected by the modeling of the continuum components. Right: the
values are measured using the upper limits luminosities of Hβ and LP β, and their colors have the same meanings. The dashed line indicates a line where the two values are identical. The correlation between these two quantities are nonexistent, suggesting large uncertainties that are associated with the determination of the dust extinction from the continuum that may be affected by the modeling of the continuum components. Right: the ![]() vs.
vs. ![]() . The meaning of the circles, square, and arrows are identical to the left panel. The
. The meaning of the circles, square, and arrows are identical to the left panel. The ![]() values are adopted from Glikman et al. (2007), and they agree well with the
values are adopted from Glikman et al. (2007), and they agree well with the ![]() .
.
Current usage metrics show cumulative count of Article Views (full-text article views including HTML views, PDF and ePub downloads, according to the available data) and Abstracts Views on Vision4Press platform.
Data correspond to usage on the plateform after 2015. The current usage metrics is available 48-96 hours after online publication and is updated daily on week days.
Initial download of the metrics may take a while.