Fig. 7
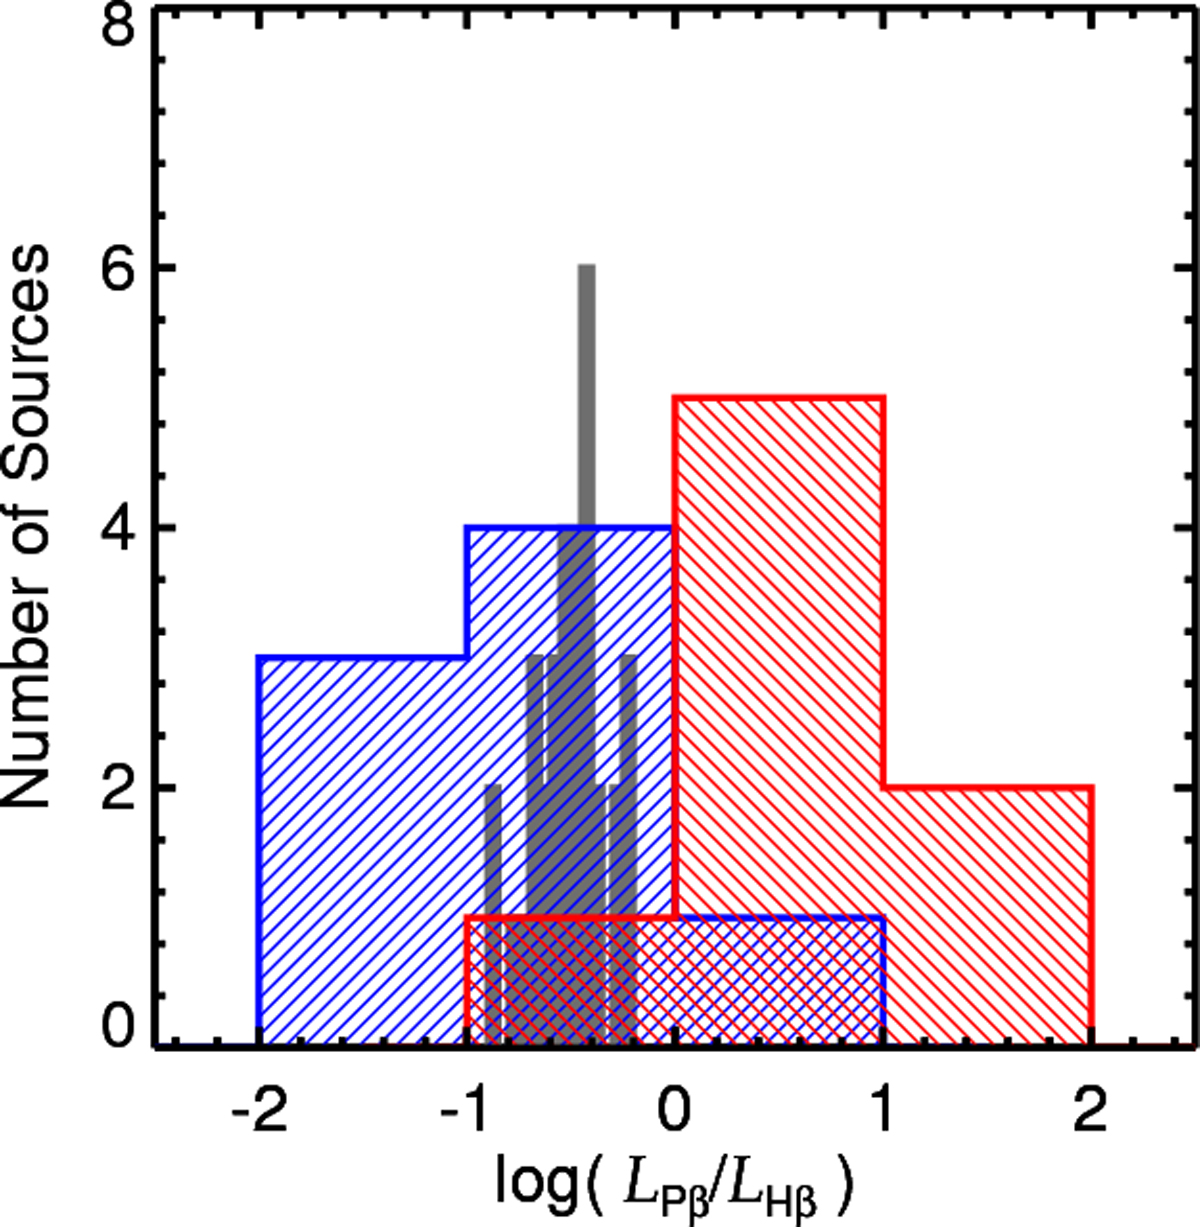
Distributions of the Pβ/Hβ luminosityratios of the red quasars (color-hatched histogram) and unobscured type 1 quasars (gray histogram). The blue and red histograms indicate the distributions of the extinction corrected and uncorrected Pβ/Hβ luminosity ratios of the red quasars, respectively. After applying the extinction correction, the Pβ/Hβ distributionof red quasars agree broadly with that of unobscured type 1 quasars, but with a much larger scatter suggesting that the extinction-correction prescription is not perfect.
Current usage metrics show cumulative count of Article Views (full-text article views including HTML views, PDF and ePub downloads, according to the available data) and Abstracts Views on Vision4Press platform.
Data correspond to usage on the plateform after 2015. The current usage metrics is available 48-96 hours after online publication and is updated daily on week days.
Initial download of the metrics may take a while.