Fig. 6
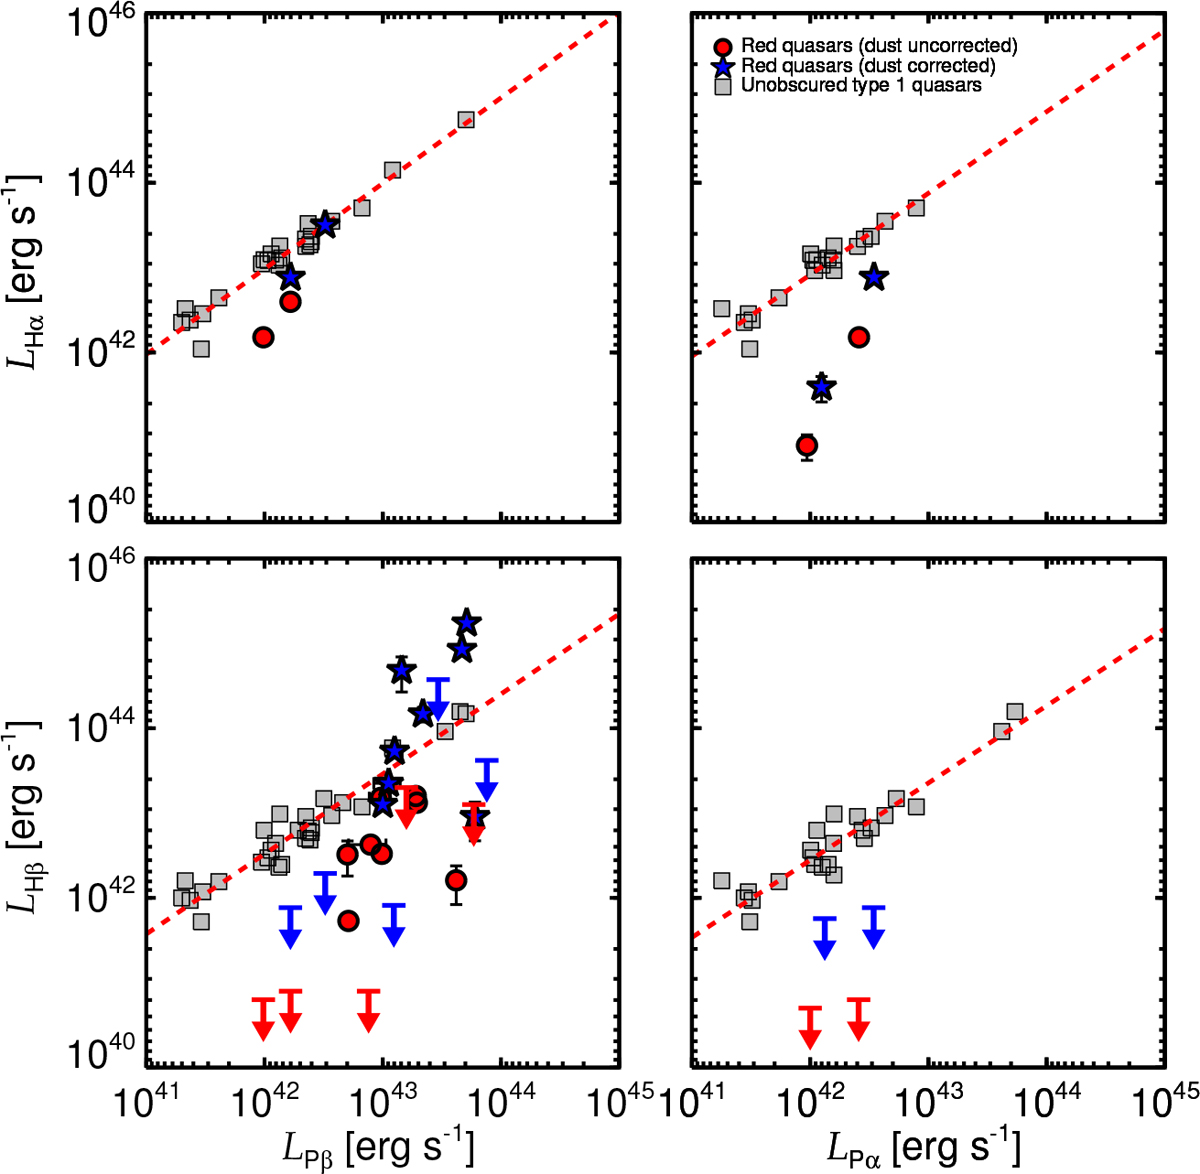
Comparison between the Paschen and Balmer line luminosities of red quasars and unobscured type 1 quasars (gray squares). The dashed red lines mean the best-fit lines between the Paschen and Balmer line luminosities of unobscured type 1 quasars. The blue stars and red circles indicate the dust-corrected and uncorrected luminosities of the red quasars, respectively. The blue and red arrows represent the upper limits of dust corrected and uncorrected LH β vs. LP β of 0036−0113, 0915+2418, 1307+2338, 1532+2415, and 1656+3821, respectively, and LHβ vs. LP α of 0817+4354 and 1307+2338, respectively. The left two panels show the comparison of the Pβ and Balmer line luminosities, and the right two panels compare the Pα with the Balmer line luminosities. Before extinction correction and at a given Paschen line luminosity, the Balmer line luminosities of red quasars are much weaker than those of unobscured type 1 quasars, while extinction corrections bring the red quasars close to the unobscured type 1 quasars.
Current usage metrics show cumulative count of Article Views (full-text article views including HTML views, PDF and ePub downloads, according to the available data) and Abstracts Views on Vision4Press platform.
Data correspond to usage on the plateform after 2015. The current usage metrics is available 48-96 hours after online publication and is updated daily on week days.
Initial download of the metrics may take a while.