Fig. 4
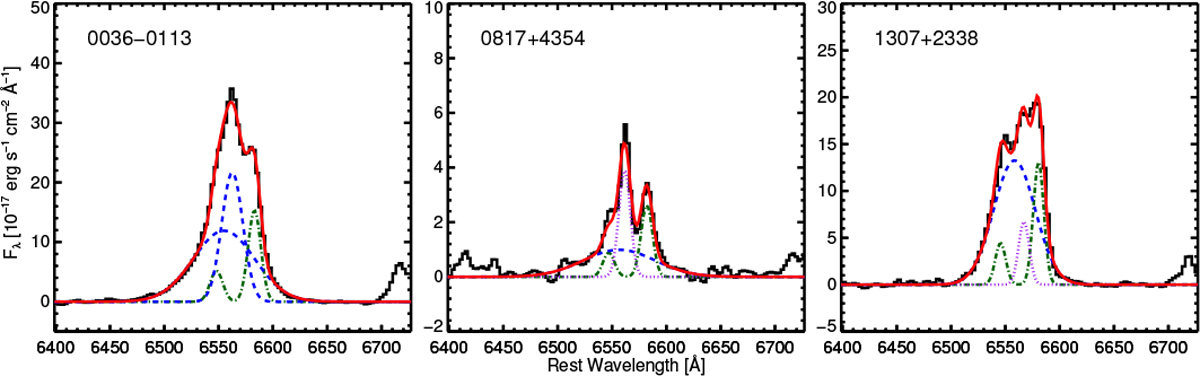
Results of the fitting of the Hα lines. The black and red solid lines indicate the continuum subtracted spectra and best-fit model, respectively. The blue dashed and purple dotted lines are the best-fit models for the broad and narrow component of the Hα line, respectively, and the green dot-dashed lines indicate the best-fit models for the [N II] doublet.
Current usage metrics show cumulative count of Article Views (full-text article views including HTML views, PDF and ePub downloads, according to the available data) and Abstracts Views on Vision4Press platform.
Data correspond to usage on the plateform after 2015. The current usage metrics is available 48-96 hours after online publication and is updated daily on week days.
Initial download of the metrics may take a while.