Fig. 3
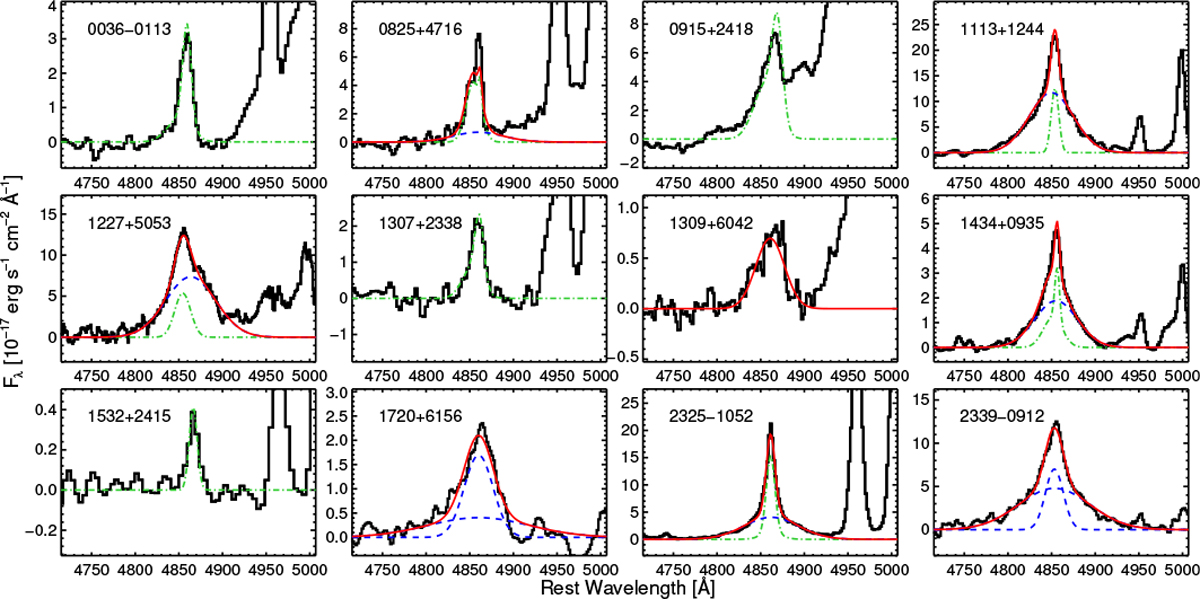
Results of the fitting of the Hβ lines. The continuum is already subtracted. The black and red solid lines indicate the observed spectra and best-fit model, respectively. The narrow component of Hβ line is fitted by using the nearby [O III] line at 5007 Å as a template, and the fitted narrow component is represented by the green dash-dotted line. The dashed blue lines represent the broad component (FWHM > 800km s−1) of the Hβ line.
Current usage metrics show cumulative count of Article Views (full-text article views including HTML views, PDF and ePub downloads, according to the available data) and Abstracts Views on Vision4Press platform.
Data correspond to usage on the plateform after 2015. The current usage metrics is available 48-96 hours after online publication and is updated daily on week days.
Initial download of the metrics may take a while.