Fig. 2
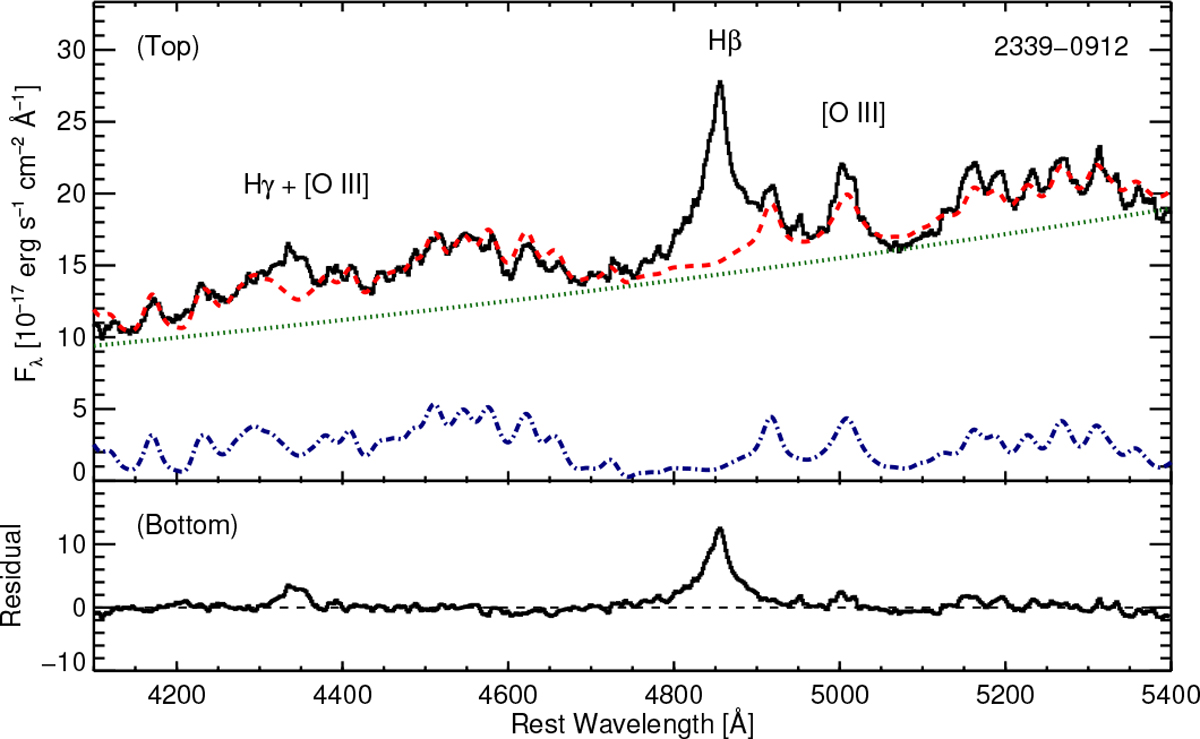
Top: optical spectrum of 2339−0912 (the black solid line) and its model spectrum components. The optical spectrum includes several emission lines such as Hγ, Hβ, and [O III]. The red dashed line indicates the fitted continuum spectrum that is composed of a power-law component (green dotted line) and a component for the Fe blends (blue dot-dashed line). Bottom: the continuum-subtracted spectrum showing broad Balmer emission lines. The continuum-subtracted spectra are used for fitting the lines.
Current usage metrics show cumulative count of Article Views (full-text article views including HTML views, PDF and ePub downloads, according to the available data) and Abstracts Views on Vision4Press platform.
Data correspond to usage on the plateform after 2015. The current usage metrics is available 48-96 hours after online publication and is updated daily on week days.
Initial download of the metrics may take a while.